Hi - I have built a rating system for an app that persuades users to provide a rating for AI responses. Their rating has an overall rating (Good, etc) and an explanation choice, plus a comment. There is some cleverness involved in data presentation and capture (I have a multilingual app, so I collect an index value not the text value, etc)… but these issues have all nicely been solved.
Where I am struggling is that I want to extract relevant statistics to present to managers.
Every line entry has a userID, then a ModuleID (the content), and then there are the ratings themselves.
What I would like to do it use relationships to connect things (all the user data… all the modules), then get a total (easy… roll-up count on one of the values)… then I want to sum up things like ‘how many good’, ‘how many poor’. And once I have this nailed, I can put it into various parts of the stats thing.
Any ideas or suggestions? Thanks!
So are you storing your ratings row-by-row? If it’s the case, you should be able to query “good” rows, “poor” rows and use rollup columns to count them.
I can extracted some numbers… but the underlying rating might have 2, 3… 5… options. And then I have up to 10 possible explanations too. I am thinking that I could roll up each row (as every user rating is it’s own row) and turn it into a json object. Then somehow roll those up… and give it to a ChatGPT created JS to process the data. Anyone have experience of doing this. And thanks for the Query tip, @ThinhDinh !
Can you show me an example of how your ratings are structured? I’m not sure I get this part.
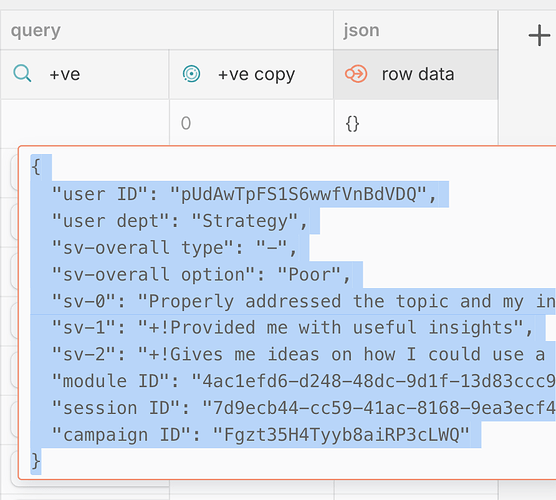
Here you go - one row of the key data in json:
{
    "user ID": "pUdAwTpFS1S6wwfVnBdVDQ",
    "user dept": "Strategy",
    "sv-overall type": "-",
    "sv-overall option": "Poor",
    "sv-0": "Properly addressed the topic and my input",
    "sv-1": "+!Provided me with useful insights",
    "sv-2": "+!Gives me ideas on how I could use a tool like this more",
    "module ID": "4ac1efd6-d248-48dc-9d1f-13d83ccc9bcc",
    "session ID": "7d9ecb44-cc59-41ac-8168-9ea3ecf4bc79",
    "campaign ID": "Fgzt35H4Tyyb8aiRP3cLWQ"
}
So, as a human reading it, Mark (user ID), rated this content (defined by the type and various module IDs) with an overall score (which has + or -, and the word like Great or Good Enough) and an explanation (from a mutlli-choice, and a comment).
Hopefully this helps 
So you want to somehow extract and roll up all sentiments/data from sv-overall option, sv-0, sv-1, sv-2 etc?
I want to do the roll-ups through the module ID, Campaign ID, etc. And I would like to get the totals for each overall option, then explanations (the sv-x values). This is to allow me to say things like:
Module 1 has 75% + ratings, but Module 2 only 35% +ve – and the reasons for 2 are 50% ‘does not pick up my response’, 25% ‘bad formatting’, etc.
Then I can have some stats by user ID - so maybe user A is 90% negative… and then with other stats I might find out User A only puts in 1 word answers (so we can exclude their stats).
Does this help? Thanks!
Hola Mark!
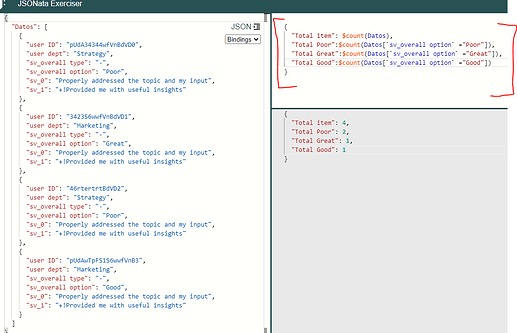
Have you tried to use some JSONata commands in order to get what you want. JSONata has some very impressive query capabilities.
Try here: https://try.jsonata.org/
Saludos!
1 Like
Solution worked out!
- json object to for every rating (row)
- join list to connect all the ratings together
- template to make a combined json with the context IDs, then the ratings)
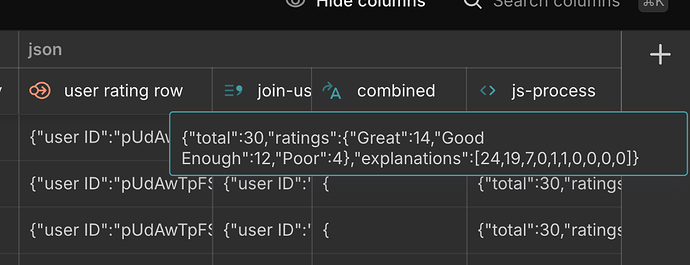
- javascript column to process the combined json (thanks to ChatGPT)
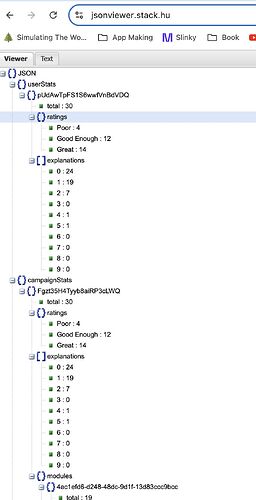
- then split out the resulting json with a helper table
I will tweak it some more to extract all the things I need. A nice combination of techniques - and help! Thank you!
2 Likes
Hola de nuevo Mark,
My suggestion might look like this:
This may be faster and easier to maintain due to your APP will load/create fewer columns.
Bye!
1 Like
I actually get rid of the need for most columns in the rating table by using JS to process the data. I then have to unwrap the json using a jsonata and helper tables to display the results.
I have to show a lot of different views on the same data set, so the JS approach gives me tons of flexibility, thankfully - and I can make the code without having a clue what I am doing, thanks to some ChatGPT magic 
1 Like


