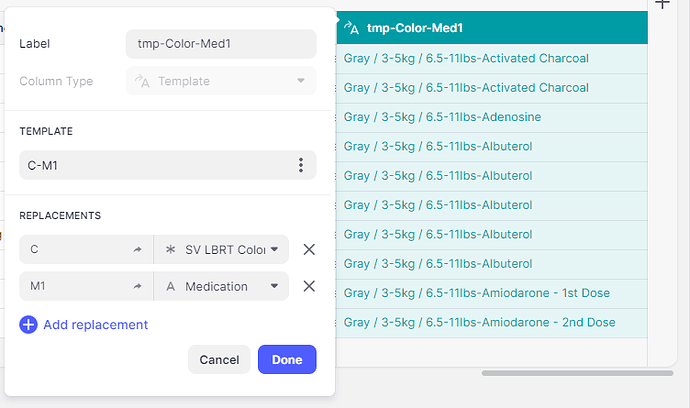
Sorry again. Just been really busy with work and other stuff lately. This one needs to deeper focus for me. Still trying to wrap my head around everything. I’m still missing the connection between indication, medication, and color. But let me suggest this…and forgive me if it’s not entirely accurate. What if you change your PEDS Calc Chart table, so everything is in rows instead of multiple columns for each color. So you would have a column for the Indication, a column for Color, a column for medication, and then a final column for the Dosage (like you already have in all of the color columns. Yes, it will translate to a lot more rows, but then you can create template columns in the PEDS table and the PEDS Chart table that join Indication, Color, and Medication together. That way, when a user selects a color, the template column will build with the right information and you can use it to create a relation to the PEDS chart table to find the same rows with the matching template. Then you can display that relation as an inline list.
I think where you are running into trouble (and I think where I get confused trying to understand it), is that you are mixing different types of data in the same table. If you are viewing a particular policy row in the PEDS table, then that is the only row you should be using. The color coded columns should be moved to a separate table since it appears to be a one to many relationship. You are trying to do a one to many relation in one single table, and I think that’s where it gets confusing.
Also, but splitting all of the color data into separate rows, then you are creating a database that is completely dynamic and not reliant on app design and conditionally showing multiple inline lists. Instead, you would end up with a single inline list that’s dynamically populated based on the data that’s returned from the relation. And, if you have a single color column, then your relation can find the correct color, based on the template, and only return those matching rows.
Ultimately, I think you are stuck between saving rows by mixing a bunch of semi-unrelated data in a single table, across multiple columns vs. laying it out so data that is similar is separated in separate tables with proper relations to link everything together. In reality, I think a single color coded dosage column would be much better to work with vs nine.
Honestly, I think if I were to do it, I would kind of tear it apart and start over. First get your Patient Management tables cleaned up with only data that is relevant to the selected policy. You are working with one single policy row, so only the data in that policy row should be what’s seen. Move your color choices used for the dropdown to a separate choices table. Then put your color coded dosage column data in it’s own table and split it apart. Yes, you will have 9 times the number of rows, but it will allow you to use the same relation (instead of a filter) as the source of a single inline list instead of having 9 separate inline lists with conditional visibility.
I think in the long run, by restructuring your data, you will have a much better experience in managing and maintaining your app. It might be more work to rebuild things, but it would be worth it when you have to make modifications in the future. I would have changed a lot more in the copy that I have, but I didn’t want to veer too far from what you already have done…but I think at this point, a restructure would be better. What you have would probably still work, but as you’ve seen, maintenance becomes a lot of work.


