I originally built this for myself ![]()
When you’re managing a complex Glide app — dozens of tables, computed columns stacked on computed columns, workflows scattered across screens, security logic that grew organically over months — you reach a point where even you don’t fully know what your app is doing anymore. Let alone being able to hand it off to someone else, onboard a client, or pick up where you left off after a few weeks away.
So I built a documentation tool for Glide apps. It’s something I’ve been refining across real projects, and the more complex the app, the more useful it becomes.
Here’s exactly what it captures:

![]() Data Model
Data Model
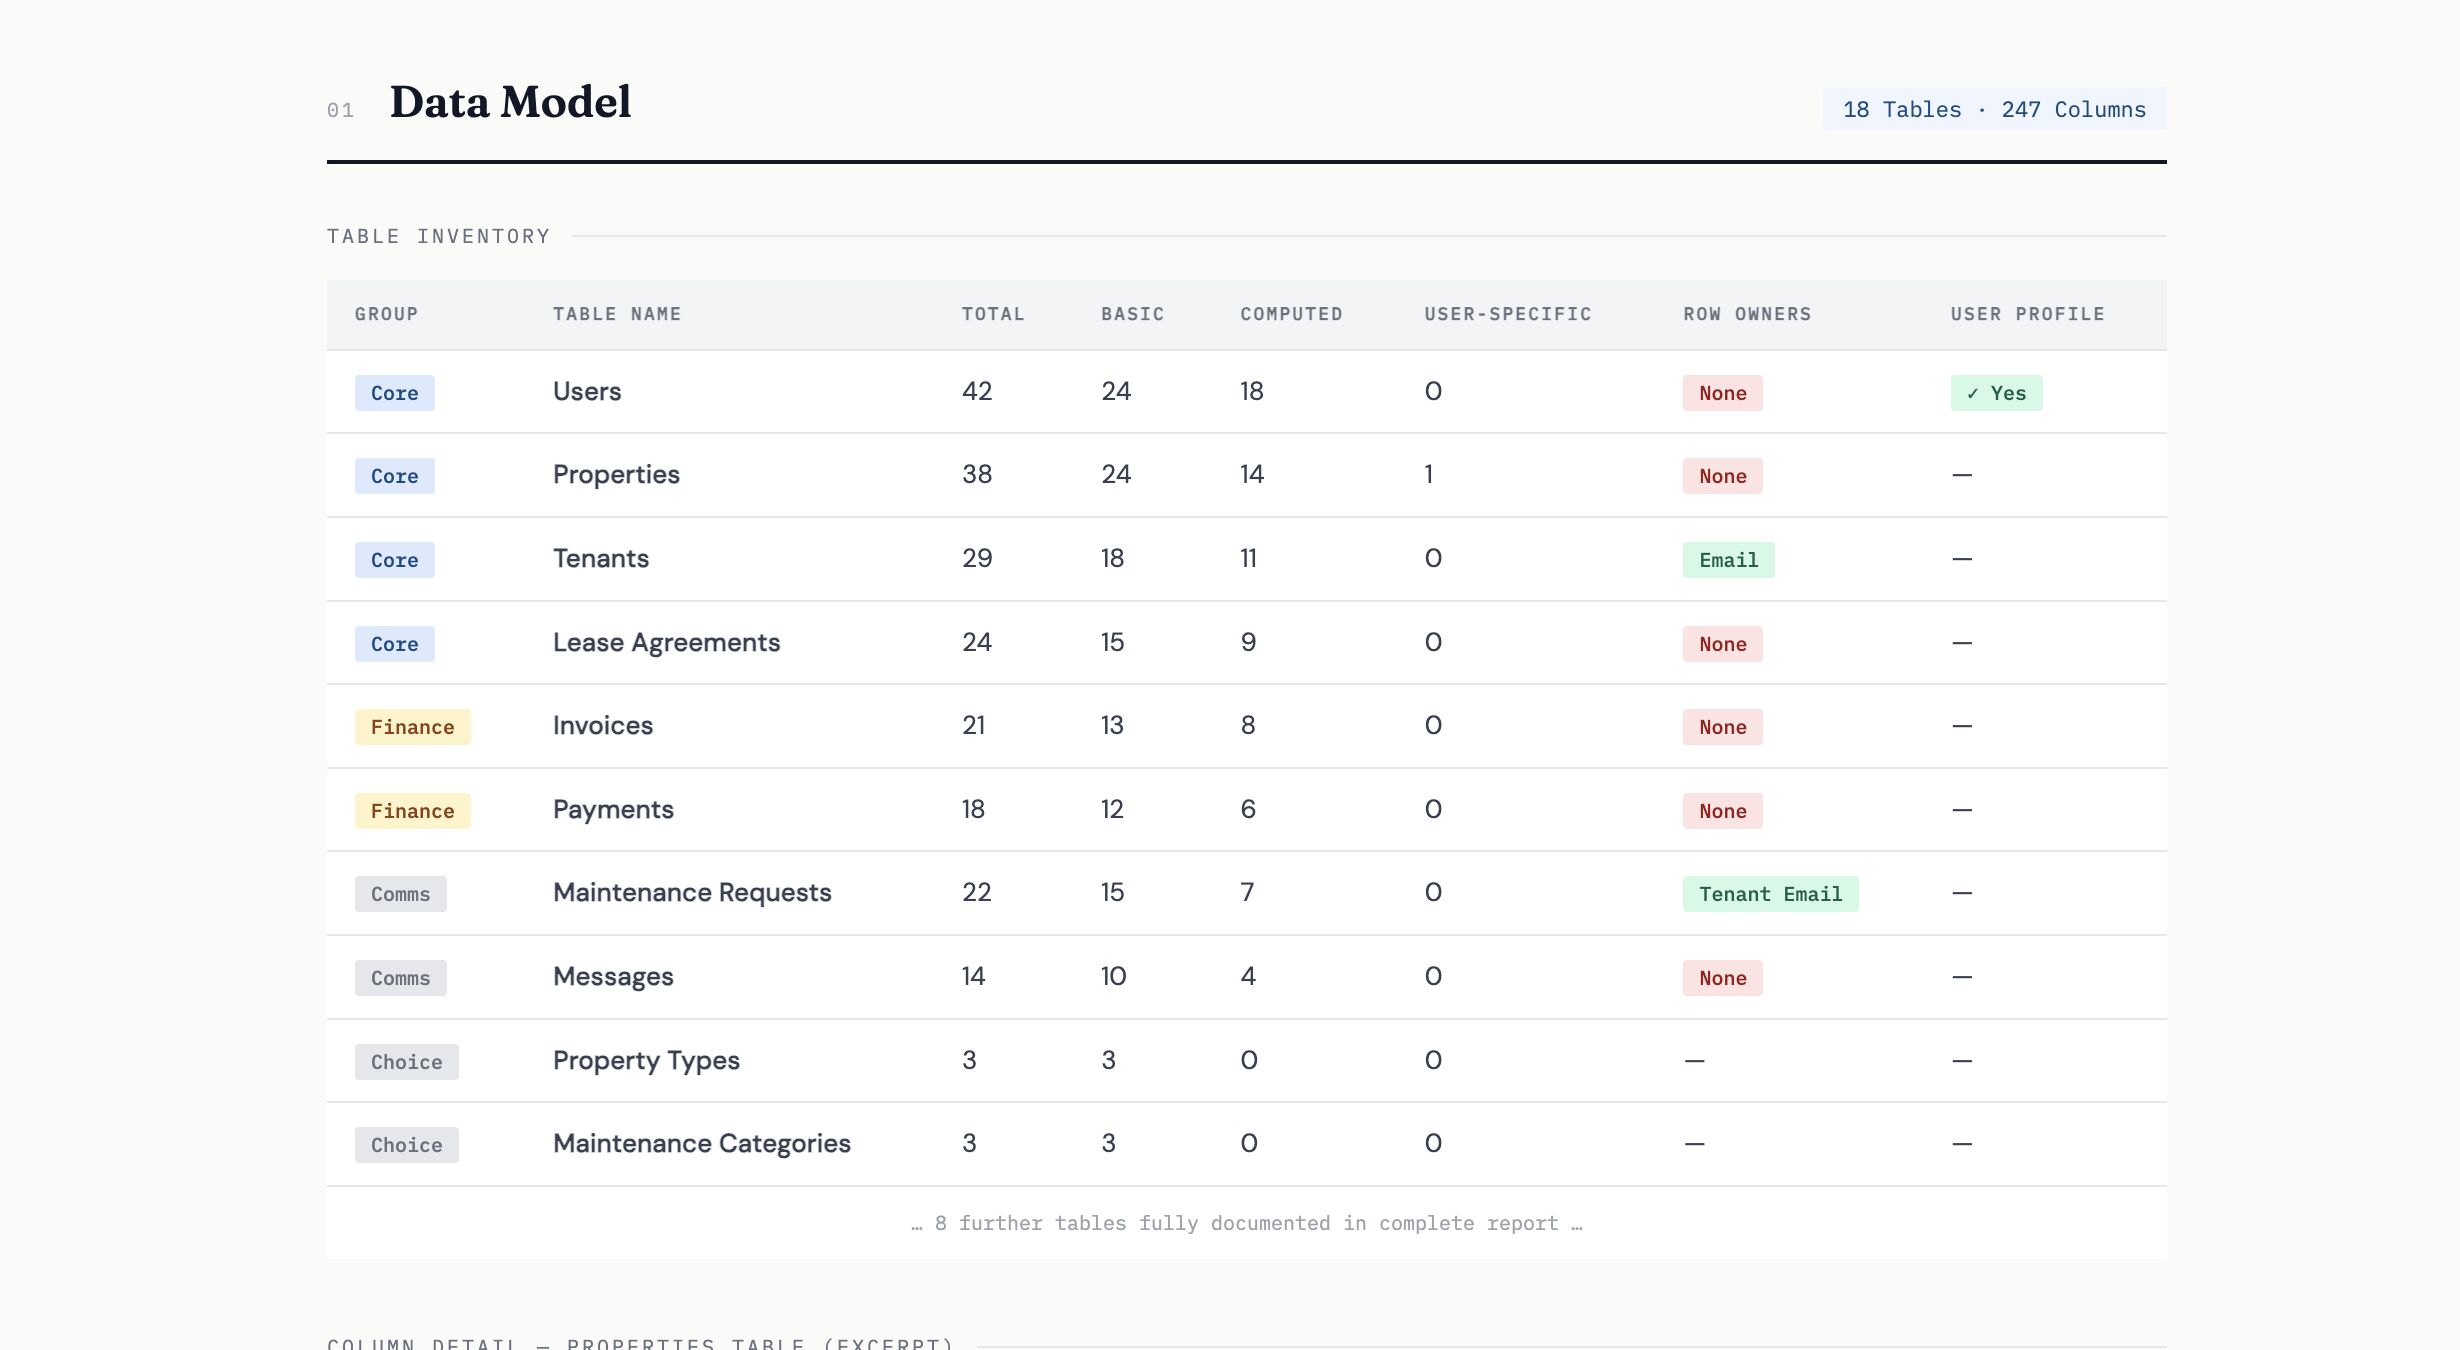
Every table in the app, documented to the column level:
-
Table name, type (Glide Table, Big Table, Google Sheets, Airtable, etc.), and approximate row count
-
Every column: name, type, category (basic / computed / user-specific), whether it’s required or protected
-
Full configuration of every computed column type:
-
Relations — target table, match columns, single vs. multiple
-
Lookups — which relation, which target column
-
Rollups — source, calculation type (count, sum, average, min, max, count_true, etc.)
-
If → Then → Else — every condition branch and fallback value
-
Math Columns — formula, variable-to-column mappings, precision, unit
-
Templates — full template string with all column placeholders
-
Queries / Filter-Sort-Limit — conditions, sort, limit, this-row matching
-
Joined List — source relation, separator
-
Single Value — source, which row (first / last / random)
-
Split Text, Make Array, Construct URL, Date Difference, Distance
-
AI Columns — Generate Text / Generate Image with prompt
-
Experimental Code Columns — full JavaScript source
-
-
Which columns are Row Owners
-
Which columns are User-Specific
-
The full relationship graph between tables — every relation, lookup, and query visualized as a dependency map
![]() Layout & Screen Structure
Layout & Screen Structure

Every screen documented, component by component:
-
Tab inventory — name, icon, source table, screen type, visibility conditions
-
Screen hierarchy — which screens exist, how they’re reached, what table/relation they’re scoped to
-
For every component on every screen:
-
Component type (Hero, Text, Inline List, Container, Button, Form Field, Chart, Map, Image, Separator, etc.)
-
Every data binding — which column feeds title, subtitle, image, meta, description
-
Style settings — card vs. list vs. grid, size, alignment
-
Visibility conditions — exactly when and for whom the component appears
-
For lists: applied filters, sort rules, search enabled/disabled, page size, CRUD permissions
-
For containers: nested components with their own bindings and conditions
-
For buttons: the full action or workflow triggered on tap
-
For forms: every field, which column it writes to, placeholder text, required/optional
-
![]() Workflows
Workflows
Every workflow captured in full:


-
Complete inventory — name, trigger type (app interaction vs. scheduled automation), source table, which screen/button triggers it
-
Step-by-step documentation of every workflow:
-
Conditions — the exact logic that must be true before proceeding
-
Set Column Value — destination column and value source
-
Add Row — target table and every column assignment
-
Delete Row — conditions and target
-
Send Email — to/from/subject/body template, plugin used (native, Outlook, SendGrid, etc.)
-
Show Notification / Toast — message and icon
-
Navigate — target screen
-
Trigger Workflow — which workflow is called
-
Loop (For Each) — source rows and what happens per iteration
-
Wait — duration
-
Webhook / API Call — URL, method, headers, body, response mapping
-
Plugin Actions — DocsAutomator, CSV export, and others fully documented
-
AI Actions — prompt, model, output column
-
-
Scheduled workflows — day/time pattern, source table, filter conditions
![]() Security & Auth
Security & Auth

-
Authentication method (Email PIN, Google, Public, etc.)
-
Whether sign-in is required or optional
-
User Profile table — which table, which columns map to email, name, role
-
All roles defined — how they’re stored and referenced
-
Row Owners configuration — which tables have it enabled, which columns are set as owners
-
Protected Columns — which columns are write-protected per role
-
User-Specific Columns — what data is stored per-user rather than per-row
-
Security findings — where visibility conditions are doing the work that Row Owners should be doing (a surprisingly common pattern, and a real risk in larger apps)
The Output
The documentation is delivered in two formats depending on what you need:
Option A — Visual HTML Report: A structured, designed document you can share with clients, stakeholders, or handoff partners. Includes a screen-by-screen mockup generated from the structural analysis (not pixel-perfect screenshots, but accurate component hierarchy), full tables, and security findings.
Option B — Markdown Documentation: Four separate files — data model, layout structure, workflows, security & auth — formatted for readability and version control. Easy to maintain, update, and diff over time as the app evolves.
Who this is actually useful for
This started as something I built for my own projects. But I’ve found it valuable in a few specific situations that keep coming up:
-
Larger apps where no single person holds the full mental model anymore
-
Handing off a build to a client who wants to understand what they’re owning
-
Onboarding a collaborator or second developer onto an existing app
-
Pre-refactor audits — before reworking a data model or workflow structure, document what’s there first
-
Security reviews — knowing exactly which tables have Row Owners and which don’t
-
Apps you haven’t touched in months — getting back up to speed fastPreformatted text
If you’d like a documentation of your Glide app, feel free to reach out.
Always happy to talk through what’s possible. ![]() Happy Gliding!
Happy Gliding! ![]()