I have a column, lets say colour, and the options are Red, Blue, Green, Yellow
I wan to create a BAR chart to show how many times each colour is chosen
What is the best way to do it ?
I have a column, lets say colour, and the options are Red, Blue, Green, Yellow
I wan to create a BAR chart to show how many times each colour is chosen
What is the best way to do it ?
Do you have this data for multiple rows, and you never plan to show this chart for multiple rows at once? A helper table would be what I think of here.
Hi Himaladin, That is EXACTLY what I need, and was going to suggest a feature request
BUT its not working for me, please take a look and see if you can see what nonsense I am doing (I am trying to Tally the Audit Ratings)
How do you write the value in the “Audit Rating” column? Are you sure your values do not contain white space?
I have a choice button
Try using the trim whitespace column to test it.
still same issue
Created a trim whitespace on the “Audit Rating”
Then applied the IF-ELSE-THEN to the trimmed whitespace
Updated chart to use the new trimmedwhitespace
but same thing
Try replacing your chart components with new ones. If the problem still persists, please submit a support ticket.
Thanks… I figured out the issue
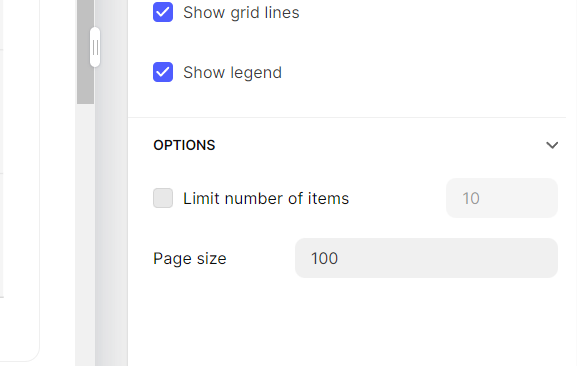
Once I increase the page size to be greater then the number of records the issue goes away… I tried to leave the size to be blank but it requires a number so I will probably stick in 1,000,000 to cover myself.
In my opinion it doesn’t make sense to have a page size for a chart
Have you replaced the chart components with new ones? How many rows does your chart handle?
If you are curious, you can also test it against other columns, to find out where the source of the problem is.
I have tested this on multiple columns across multiple tables. The chart will handle as many rows as I set it in the page size settings, which by default is 24.
The page size seems to split up the table, and hence the reason why I was getting 5 pages is because I had 94 rows and 98/24 = 4.08 and hence 5 pages
Once I increase the page size to 100 then it works fine.
I cannot see a case where you will not want to use all the rows for the chart
Just testing whether this component has a limit on data processing capabilities.
Yes I saw it too. It turns out that as long as the page size is set to greater than or equal to the number of rows, pagination does not appear.
@NoCodeAndy, is the behavior of a chart supposed to be like this? Or is this a bug?


