Hello Everyone,
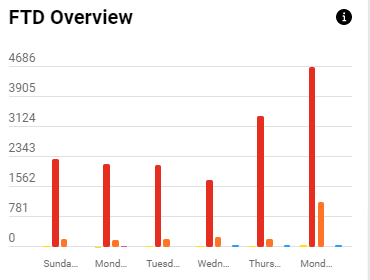
This is Akash. I have an app on Glide where in I daily add lead numbers coming from different sources to a section and reflect them in a bar chart. The issue I am facing is that the bar chart is reflecting numbers from every row I add and not limiting it to say 5 or 7, making it look very congested and difficult for users to understand. I wish I could restrict it! to few recent rows. Can someone please suggest or help in this.
image|370x280
Best,
Akash
You can do something like this:
-
Create a “row value” column in Sheet. Put this in the first cell of your next column.
={“Row value”;ARRAYFORMULA(IF(A2:A<>"",ROW(A2:A)-1,""))}
-
In Glide Editor, create a rollup column, use that rollup on the row value above and take the max.
Let’s say you want to display the last 5 rows only. Create a math column - let’s say “Bennchmark” with the formula:
Max - 4
With Max pointing to the max rollup above.
Display any rows with row value greater than or equal to “Benchmark”. We only deduct 4 because we take into account the last item as well.
Also, this is not a bug so while you can still use my recommendation, I have change the post to a “Feature request”.
You can submit a request on here.
Thank you @ThinhDinh. Will try the suggestion shared by you. I saw a similar feature request already existing and voted for it. Hope to see this feature soon 