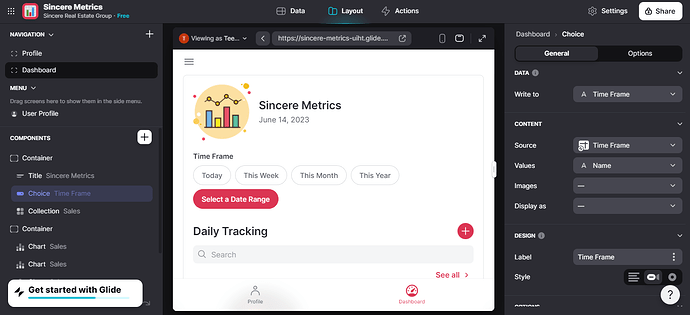
l created a choice component “Today”, “This Week”, “This Month”, “This Year”, “Select a Date Range” from the data source “TimeFrame”… l have a record of date on another date source “Sales”… l want the choice component to have the ability to filter these stats “Contract, Offers, Closings” whenever l select a choice
I brief overview of what I would do…take the values from your selected choice and the custom date inputs, and bring them into the table that contains the chart data using Single Value columns. Then you’ll need math columns to subtract the number of days for a week, month, year, etc. Followed by IF columns to determine which rows are in range. Ultimately you want a true/false value that you can use for filtering.
It’s a bit complicated to explain, and there are some open ended questions. Does a week mean the past 7 days or the current week. Did a month mean the past 30 days, 31 days, 28 days, or the current month. Does Year mean the past 365 days or year to date. All of those things will determine how you set up your math columns.
The week means the current week likewise the current month and year… l’ll appreciate it if you can help me out… l have been on this since last two weeks.
That makes it a bit easier.
First, in your choices table, create 4 math columns like the following, and replace Now with Now:
TodayNow:
YEAR(Now)*10000+MONTH(Now)*100+Day(Now)
WeekNow:
YEAR(Now)*100+WEEKNUM(Now)
MonthNow:
YEAR(Now)*100+MONTH(Now)
YearNow:
YEAR(Now)
Next create an IF column in your choices table that looks like this. It will check the choice value in each row and return the appropriate math column value. The final ELSE value will be the word ‘DateRange’:
IF choice is Today then TodayNow
ELSEIF choice is Week then WeekNow
ELSEIF choice is Month then MonthNow
ELSEIF choice is Year then YearNow
ELSE 0
Change your choice component to display the words like you are now, but have it write the value from the IF column above instead.
I don’t know how you are handling the custom date range, but I assume it’s two date columns. I would create two math columns to convert the date into a number like above:
YEAR(FromDate)*10000+MONTH(FromDate)*100+Day(FromDate)
YEAR(ToDate)*10000+MONTH(ToDate)*100+Day(ToDate)
In your chart data table add three single value columns. One to retrieve the value from the selected choice, and two to retrieve the from and to math values from the custom dates.
In your charts data table, I would set up 4 math columns as follows. You will replace date with the date value in you chart data rows.
FullDate:
YEAR(Date)*10000+MONTH(Date)*100+Day(Date)
WeekDate:
YEAR(Date)*100+WEEKNUM(Date)
MonthDate:
YEAR(Date)*100+MONTH(Date)
YearDate:
YEAR(Date)
Now your charts data table should contain 3 single value columns and 4 math columns. Add a final IF columns like this:
IF FullDate = sv-Choice then 'true'
ElseIF WeekDate = sv-Choice then 'true'
ElseIF MonthDate = sv-Choice then 'true'
ElseIF YearDate = sv-Choice then 'true'
ElseIF sv-choice > 0 then 'false'
ElseIF FullDate < sv-FromDate then 'false'
ElseIF FullDate > sv-ToDate then 'false'
Else 'true'
After all of that, you should be able to filter your chart where the final IF column value is checked (‘true’). I’m sure there are better ways to set it up with some javascript, and I may have missed something, but this is probably the easiest to understand.
Thank you very much for your response… it’s solved.
This topic was automatically closed 24 hours after the last reply. New replies are no longer allowed.

