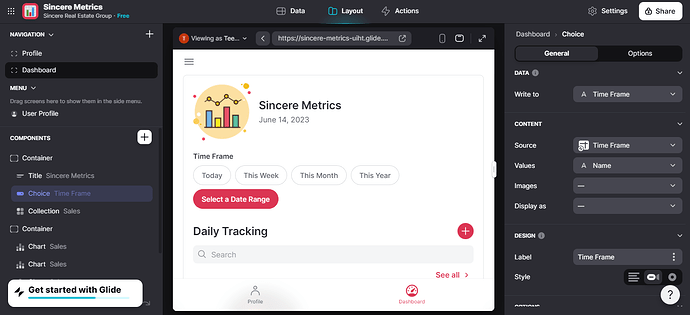
l created a choice component “Today”, “This Week”, “This Month”, “This Year”, “Select a Date Range” from the data source “TimeFrame”… l have a record of date on another date source “Sales”… l want the choice component to have the ability to filter these stats “Contract, Offers, Closings” whenever l select a choice
In the quest of doing this, l found a youtube video “Glide Dynamically Filter your data with TIMEFRAME by Robert Petitto”… l got stuck toward the end of the video because the relational column was used as the data source but it doesn’t as an option for me… kindly help me out
Is your Work Table the source of your Dashboard screen?
If it is, you should be able to use that relation column as a source for your Chart.
Note that relations are shown right at the bottom of the list of sources, so you might have to scroll down to see it.
The Work Table is not the source of the dashboard screen but it’s Sales… l check the bottom of the list, l couldn’t find it.
You can see what l’m saying
Okay, so that won’t work.
If you want to use a relation as a source of a chart, the relation needs to be in the table that the screen is attached to (or you need to attach the screen to the table that contains the relation column).
In this case, you probably should be building your Dashboard on top of the helper table.
top of the helper table ???.. what do you mean by that
Sorry, got my terminology mixed. I’m too used to referring to Work Tables as Helper Tables.
What I meant is you probably should use your Work Table as the source of your Dashboard screen.
You can test this quite easily. Create a new tab and set the Work Table as the source. Then add a chart, and you should find that the relation column is an available selection for the source of the chart.
1 Like


