I have data charts that show users who the most popular salons are:
This is based off the SUM of views from Google Analytics - it updates every day.
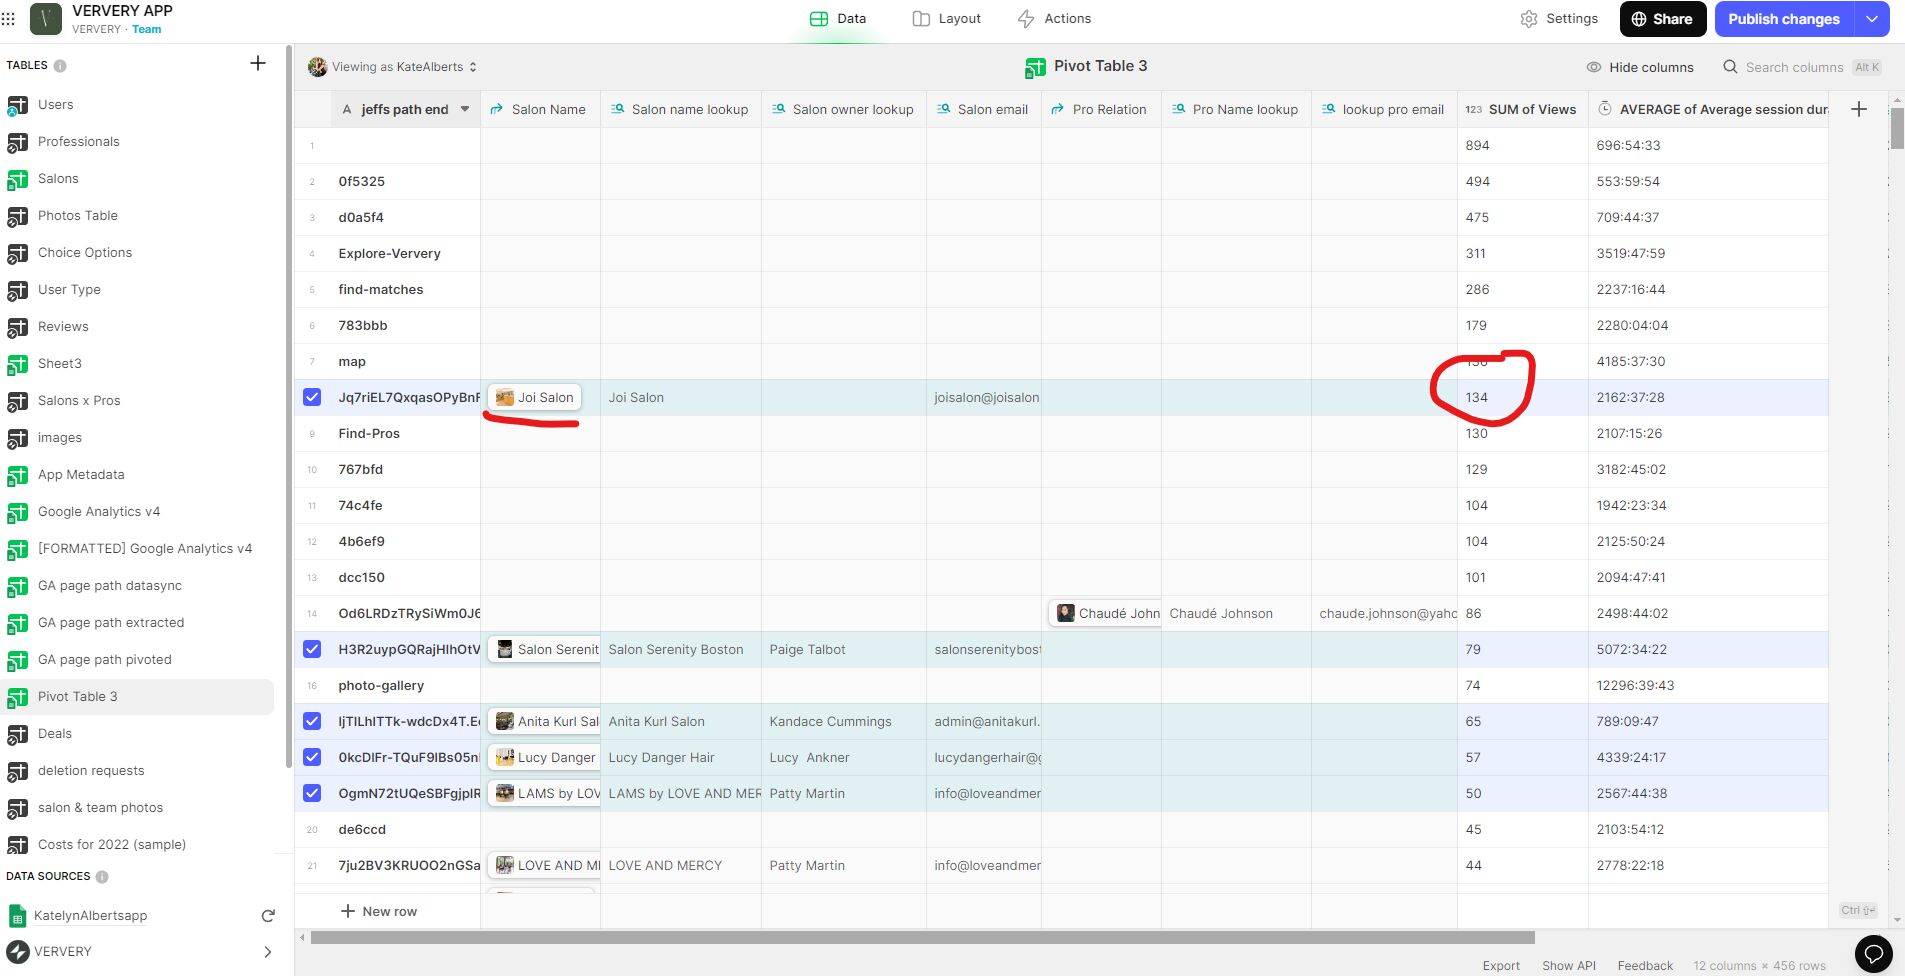
However, the salon that most recently has the most views and is actually at the number 1 spot in the data table (seen below) Joi Salon…is missing on the chart.
All of the other salon views are updating accurately. Any idea what could be causing this?
You are limiting the number of items in your chart. It’s that intentional? Do you have any filtering or sorting on your chart?
yes, intentional, as it’s a Top Ten list.
If i increase to 11, it just ads on another lower salon profile:
Yes my only filter is that I want it to bring back valid salon rows from the data table:
*I circled the wrong column, apologies, however, remains valid!
I have an idea, but just want to make sure I’m following along…is the Pivot Table 3 table built from the GA table?
yes, you actually helped me fix it so that it automatically updated correctly and it has since been called 'Jeff’s path"
Ha!  Nice.
Nice.
Ok, here’s something to try. I think in your Dashboard table, add a Query column and point it to to Pivot Table 3. Set up a filter in the query column to only choose the rows where the lookup column is not empty (just like the filter on your chart). Then set the sorting in the query column to sort descending by view count. I’m thinking you should then be able to set the query column as the source of the chart, and the sorting in the query column should show the highest 10 records in the chart.
phew ok i might have to tackle this tomorrow since its about midnight, however, I don’t have a dashboard table, do you mean my user table?
The pivot table is connected to my datasync table which is connected to my salons and pros tables. so which one do i put the query on? the salon table?
thank you!
The query would go into whichever table is the source of this screen.
ok yes user table! ok i’ll work on that and report back, thank you!
OK so you’re right, the query made the salons show up in descending order correctly! (joi salon is first here and that’s the one that was missing)
But it looks like i can’t use it as the value for the chart. It doesn’t show up as an option.
Plus i assume i also need to make another column that grabs the salon name from the row IDs so i can use those as the display.
You should be using the query as the source of the chart instead of the user table.
As Jeff said, you shoud use the query as the source.
Also overall my opinion, you’re using way too much Google Sheets tabs so it’s hard to track.
Maybe split a bit the code in different Google Sheets or tabs.
So that you can see better where is the bug.
Have fun, François
Ah ok so i did all that and it still wasn’t working. Then i realized that one of my relations was wrong, that seemed irrelevant at the time, but then i fixed it and now everything is working!
screen shot of the first picture i sent, where the salon was missing the “salon owner lookup”:
Thank you as always!
I appreciate that, I’m actually not using 3 of the sheets related to the GA as they are old - but i don’t know to delete them so 
If you want to delete the Google Sheet Tabs then delete them from Google Sheets itself.
Before you delete anything use find all uses on each column. That will give you peace of mind that you won’t break anything.
… and duplicating the app (copy the sheet) is always a good way to start