Creating a column populated with multiple rows from data within an API call

Howdy Brains Trust,

So I am struggling with a way to extract data from an API call in order to populate a column with multiple rows containing the extracted info.

The Breakdown

My API call is full of weather data. Things like observations or forecasts (temp, humidity, wind strength, wind direction) for a single day, which is broken down into hourly increments. As an example, predicted wind_strength for each of the 24hrs within the day.

Now while I can extract the wind_strength data via a Query JSON column targeting the api call column with something like: hourly.wind_speed… the wind speed data is returned in what I think may be a single array? → [
17.9,
18.6,
18.9,
18.9,
17.7,
18.8,
18.7,
19,
17.6,
16.6,
18.2,
19.1,
19.7,
18.8,
17.9,
17.8,
19.8,
20,
20.1,
20,
20.1,
19,
19,
18.5
]

What I need to do is extract each of the 24 x hourly wind strengths and have them populate into separate column that has 24 rows.

Establishing the 24 rows is easy via the creation of a simple 123 Numbers column and manually inserting 0000, 0100, 0200, 0300 (and so on) along 24 rows…

In essence I am trying to take/extract a horizontal output and populate it vertically into a separate column (if that makes sense).

I also need to achieve this for multiple sets of data within the api call. IE Temperature, Wind Strength, Wind Direction, Swell Size, Swell Direction, Water Temp, Tide Movement along with a few others.

Please note I am using Glide Data tables (so functionality associated with the same request within Google Sheets wont work.)

*I have multiple data tables with dozens of rows in each so moving the entire app across to Google Sheets Tables would be a massive effort (time and cost wise) so not a real option.

Thoughts and feedback please !

Here’s a screenshot for visual reference:

This is quite doable with a series of Query JSON and/or JavaScript columns.
Can you give me a sample of the returned JSON?
It will be easier for me to do it, then explain how to do it, rather than try and describe the steps.

(please, when you paste the JSON, enclose it in triple backticks so the formatting isn’t mangled).

2 Likes

Hi Darren and thank you for the reply and the offer to assist. Can I please confirm for returned JSON, are you referring to the Query JSON column I have created to extract one of the lines of data ?

as in → Querry (Tide) \\\[ 0.29, 0.23, 0.2, 0.18, 0.19, 0.23, 0.29, 0.35, 0.4, 0.44, 0.46, 0.47, 0.48, 0.5, 0.54, 0.6, 0.67, 0.75, 0.8, 0.83, 0.83, 0.79, 0.72, 0.61]

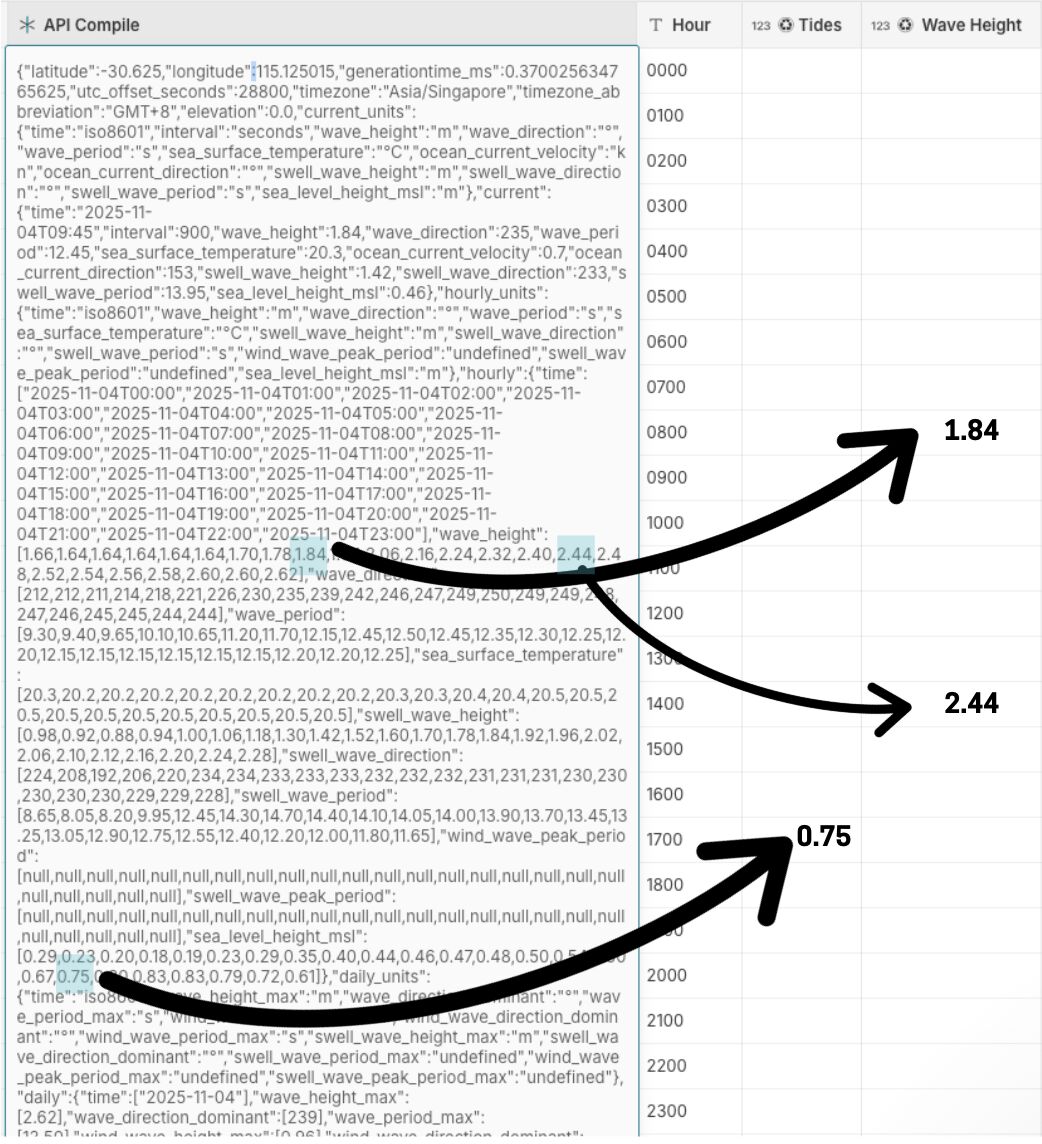
This is the returned API call:

{
  "latitude": -30.625,
  "longitude": 115.125015,
  "generationtime_ms": 0.370025634765625,
  "utc_offset_seconds": 28800,
  "timezone": "Asia/Singapore",
  "timezone_abbreviation": "GMT+8",
  "elevation": 0.0,
  "current_units": {
    "time": "iso8601",
    "interval": "seconds",
    "wave_height": "m",
    "wave_direction": "°",
    "wave_period": "s",
    "sea_surface_temperature": "°C",
    "ocean_current_velocity": "kn",
    "ocean_current_direction": "°",
    "swell_wave_height": "m",
    "swell_wave_direction": "°",
    "swell_wave_period": "s",
    "sea_level_height_msl": "m"
  },
  "current": {
    "time": "2025-11-04T09:45",
    "interval": 900,
    "wave_height": 1.84,
    "wave_direction": 235,
    "wave_period": 12.45,
    "sea_surface_temperature": 20.3,
    "ocean_current_velocity": 0.7,
    "ocean_current_direction": 153,
    "swell_wave_height": 1.42,
    "swell_wave_direction": 233,
    "swell_wave_period": 13.95,
    "sea_level_height_msl": 0.46
  },
  "hourly_units": {
    "time": "iso8601",
    "wave_height": "m",
    "wave_direction": "°",
    "wave_period": "s",
    "sea_surface_temperature": "°C",
    "swell_wave_height": "m",
    "swell_wave_direction": "°",
    "swell_wave_period": "s",
    "wind_wave_peak_period": "undefined",
    "swell_wave_peak_period": "undefined",
    "sea_level_height_msl": "m"
  },
  "hourly": {
    "time": [
      "2025-11-04T00:00",
      "2025-11-04T01:00",
      "2025-11-04T02:00",
      "2025-11-04T03:00",
      "2025-11-04T04:00",
      "2025-11-04T05:00",
      "2025-11-04T06:00",
      "2025-11-04T07:00",
      "2025-11-04T08:00",
      "2025-11-04T09:00",
      "2025-11-04T10:00",
      "2025-11-04T11:00",
      "2025-11-04T12:00",
      "2025-11-04T13:00",
      "2025-11-04T14:00",
      "2025-11-04T15:00",
      "2025-11-04T16:00",
      "2025-11-04T17:00",
      "2025-11-04T18:00",
      "2025-11-04T19:00",
      "2025-11-04T20:00",
      "2025-11-04T21:00",
      "2025-11-04T22:00",
      "2025-11-04T23:00"
    ],
    "wave_height": [1.66,1.64,1.64,1.64,1.64,1.64,1.70,1.78,1.84,1.94,2.06,2.16,2.24,2.32,2.40,2.44,2.48,2.52,2.54,2.56,2.58,2.60,2.60,2.62],
    "wave_direction": [212,212,211,214,218,221,226,230,235,239,242,246,247,249,250,249,249,248,247,246,245,245,244,244],
    "wave_period": [9.30,9.40,9.65,10.10,10.65,11.20,11.70,12.15,12.45,12.50,12.45,12.35,12.30,12.25,12.20,12.15,12.15,12.15,12.15,12.15,12.15,12.20,12.20,12.25],
    "sea_surface_temperature": [20.3,20.2,20.2,20.2,20.2,20.2,20.2,20.2,20.2,20.3,20.3,20.4,20.4,20.5,20.5,20.5,20.5,20.5,20.5,20.5,20.5,20.5,20.5,20.5],
    "swell_wave_height": [0.98,0.92,0.88,0.94,1.00,1.06,1.18,1.30,1.42,1.52,1.60,1.70,1.78,1.84,1.92,1.96,2.02,2.06,2.10,2.12,2.16,2.20,2.24,2.28],
    "swell_wave_direction": [224,208,192,206,220,234,234,233,233,233,232,232,232,231,231,231,230,230,230,230,230,229,229,228],
    "swell_wave_period": [8.65,8.05,8.20,9.95,12.45,14.30,14.70,14.40,14.10,14.05,14.00,13.90,13.70,13.45,13.25,13.05,12.90,12.75,12.55,12.40,12.20,12.00,11.80,11.65],
    "wind_wave_peak_period": [null,null,null,null,null,null,null,null,null,null,null,null,null,null,null,null,null,null,null,null,null,null,null,null],
    "swell_wave_peak_period": [null,null,null,null,null,null,null,null,null,null,null,null,null,null,null,null,null,null,null,null,null,null,null,null],
    "sea_level_height_msl": [0.29,0.23,0.20,0.18,0.19,0.23,0.29,0.35,0.40,0.44,0.46,0.47,0.48,0.50,0.54,0.60,0.67,0.75,0.80,0.83,0.83,0.79,0.72,0.61]
  },
  "daily_units": {
    "time": "iso8601",
    "wave_height_max": "m",
    "wave_direction_dominant": "°",
    "wave_period_max": "s",
    "wind_wave_height_max": "m",
    "wind_wave_direction_dominant": "°",
    "wind_wave_period_max": "s",
    "swell_wave_height_max": "m",
    "swell_wave_direction_dominant": "°",
    "swell_wave_period_max": "undefined",
    "wind_wave_peak_period_max": "undefined",
    "swell_wave_peak_period_max": "undefined"
  },
  "daily": {
    "time": ["2025-11-04"],
    "wave_height_max": [2.62],
    "wave_direction_dominant": [239],
    "wave_period_max": [12.50],
    "wind_wave_height_max": [0.96],
    "wind_wave_direction_dominant": [354],
    "wind_wave_period_max": [3.85],
    "swell_wave_height_max": [2.28],
    "swell_wave_direction_dominant": [228],
    "swell_wave_period_max": [null],
    "wind_wave_peak_period_max": [null],
    "swell_wave_peak_period_max": [null]
  }
}

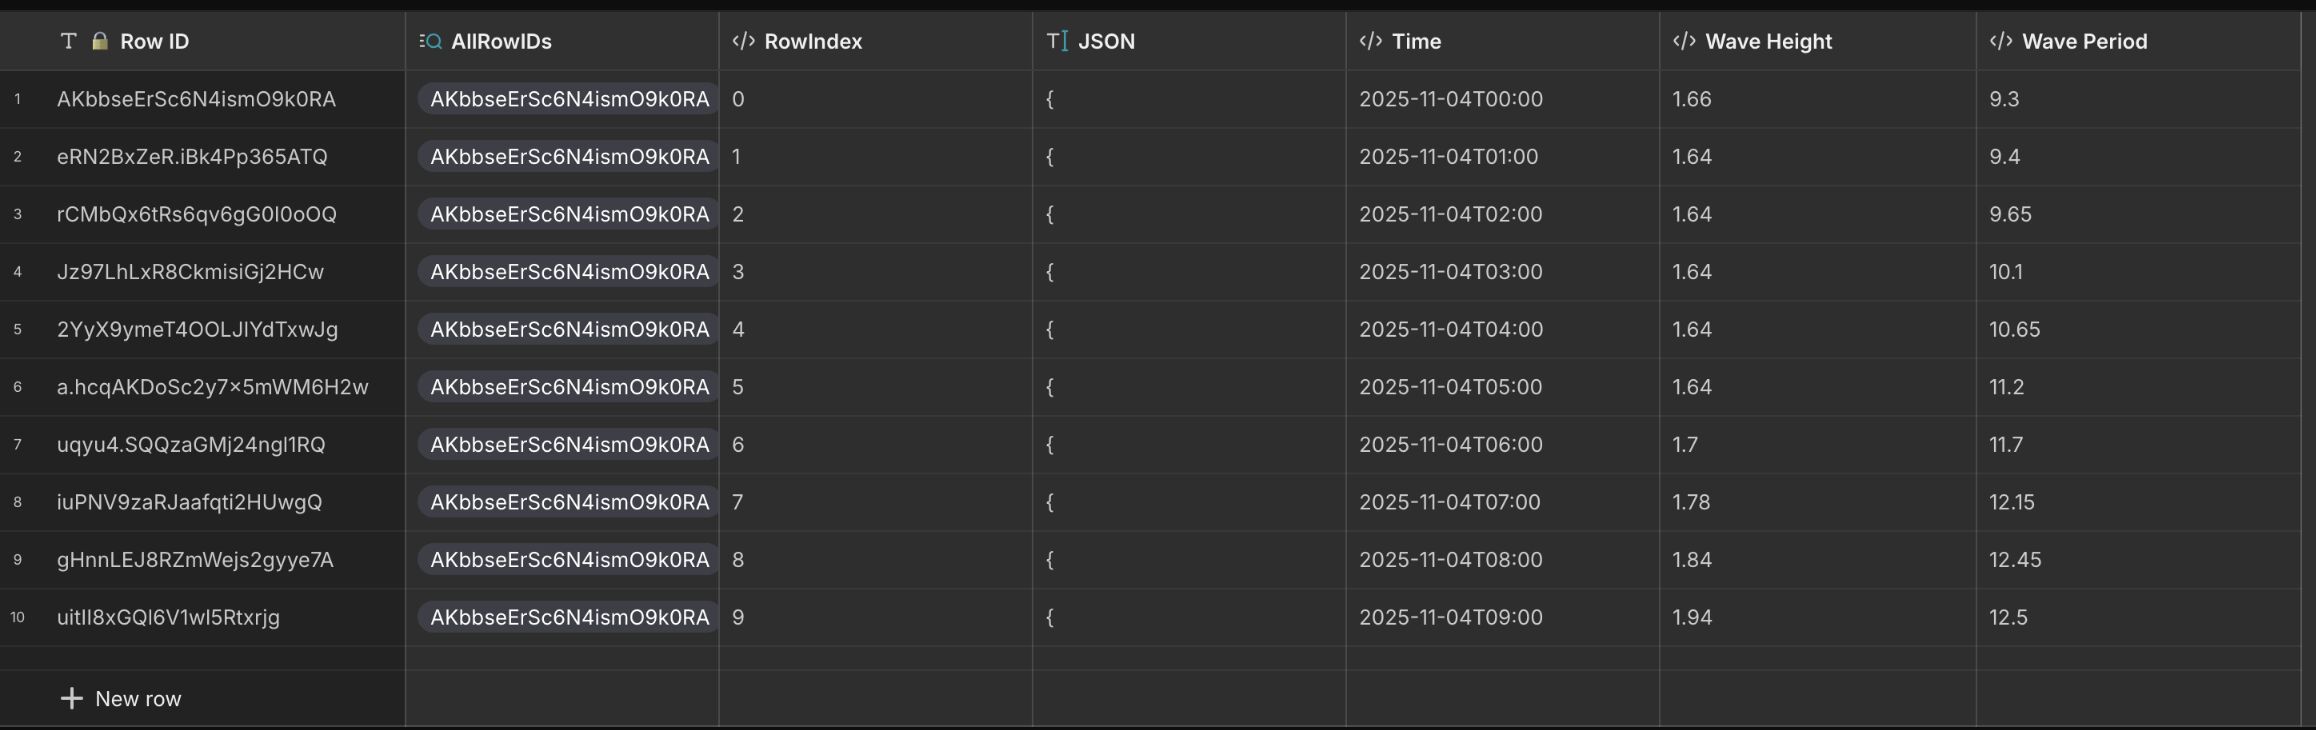
To extract the sea_level_height data I used a query JSON column using: hourly.sea_level_height_msl

Which returned → Query (Tide) \\\[ 0.29, 0.23, 0.2, 0.18, 0.19, 0.23, 0.29, 0.35, 0.4, 0.44, 0.46, 0.47, 0.48, 0.5, 0.54, 0.6, 0.67, 0.75, 0.8, 0.83, 0.83, 0.79, 0.72, 0.61]

Please let me know if this is not the correct info you require ?

Cheers

Kev

It is, but the formatting is messed up. Never mind, I can get ChatGPT to fix that…

The formatting of the api call or the Query (or both) ?

I just edited your post and fixed the JSON. The problem when you just paste a bunch of JSON is that the double-quotes get converted to smart quotes, which breaks the formatting. That’s why I asked you to enclose it in triple-backticks. If you edit that post again and look, you’ll see what I mean.

Anyway, give me a little while and I’ll come back with a solution.

My apologies. I copied it direct from the cell within the api call column

That’s fine, but when you paste here you need to enclose it in triple-backticks, like so:

Okay, so here is how you do it:

  • Make sure your rows are numbered, starting at zero
  • Make sure you have the full JSON response in the same column in every row (in the above, that’s my JSON column)
  • For each property that you want to extract the hourly data for, use a JavaScript column with the following code:
const data = JSON.parse(p1);
return data.hourly.wave_height[p2];

Obviously, you should modify each column slightly to return the correct property. eg. for Wave Period it will be:

const data = JSON.parse(p1);
return data.hourly.wave_period[p2];
2 Likes

Awesome Darren, thank you so much.

I will attempt to replicate within my data table across the next few hours and report back.

You Kind Sir, are an Absolute Legend !

1 Like

Awesome of you to show the details of this technique.

Hi Darren, I have been trying to ‘extend’ the java Script column to return a second set of data.

The API call has now be expanded to return 7 days of forecasts (7 x 24 hour data sets). Please find excerpt below:

“wave_height”:[2.60,2.56,2.52,2.48,2.46,2.42,2.40,2.36,2.34,2.34,2.32,2.32,2.36,2.40,2.44,2.50,2.54,2.60,2.62,2.62,2.64,2.62,2.58,2.56,2.52,2.48,2.44,2.40,2.36,2.32,2.28,2.22,2.18,2.14,2.08,2.04,2.02,2.00,1.98,2.00,2.04,2.06,2.06,2.06,2.06,2.04,2.02,2.00,1.96,1.90,1.86,1.82,1.78,1.74,1.70,1.68,1.64,1.62,1.58,1.56,1.56,1.56,1.56,1.62,1.70,1.76,1.76,1.78,1.78,1.78,1.76,1.76,1.74,1.72,1.70,1.70,1.68,1.68,1.68,1.70,1.70,1.68,1.68,1.66,1.66,1.66,1.66,1.74,1.84,1.92,1.92,1.92,1.92,1.88,1.82,1.78,1.72,1.64,1.58,1.54,1.52,1.48,1.48,1.46,1.46,1.44,1.44,1.42,1.42,1.42,1.42,1.46,1.50,1.54,1.56,1.56,1.58,1.58,1.60,1.60,1.58,1.56,1.54,1.52,1.48,1.46,1.46,1.46,1.46,1.56,1.66,1.76,1.92,2.10,2.26,2.36,2.44,2.54,2.54,2.52,2.52,2.52,2.50,2.50,2.50,2.48,2.48,2.42,2.36,2.30,2.22,2.14,2.06,2.02,1.96,1.92,1.92,1.90,1.90,1.90,1.90,1.90,1.90,1.92,1.92,1.94,1.98,2.00],

I duplicated your Java Script column and am attempting to ‘target’ the second day of figures (values 24 - 47) in order to return the 24 hour predictions for Day 2 and align them to the Row Index from your original workings.

The intent, Java Script Column A returning data as per your original workings:

const data = JSON.parse(p1);

return data.hourly.wave_height[p2];

Then a second version: Java Script Column B returning data targeting Day 2 24 hour periods (data sets 24-47)

So the real question is, is it possible to expand the Java Script to ‘extract’ values 24 - 47 in the wave-height collection ?

const data = JSON.parse(p1); (remains the same)

return data.hourly.wave_height[p2]; (includes a function targeting values 24 - 47) ???

Wouldn’t you just need to add more rows to the table and continue incrementing the index column?

Or are you trying to get hour 1 of each day in the same row for example, so 7 columns that represent the first hour of each day in the first row, and then the 2nd hour for each day in the second row, and so on? If so, then you would just need to add 24 to the index in the javascript to bump the pointer in the array to the next day. 48 for the third day, and so on…

So it it would be p2+24 or p2+48.

2 Likes

Hi Jeff, yes to your second point ‘…trying to get hour 1 of each day in the same row…’

Can you please confirm where the +24 is added to the current java script →

const data = JSON.parse(p1);
return data.hourly.wave_height[p2];

Try changing ‘p2’ to ‘p2+24’.

If that doesn’t work, try ‘parseInt(p2) + 24’ instead.

2 Likes

Hmmm, must be doing something wrong at my end. Cant get it to run without throwing errors and column remains empty

WINNING !

Created a new Query JSON column. Inserted the details as suggested.

Data Java Script Code:

const data = JSON.parse(p1);
return data.hourly.wave_height[parseInt(p2)+24];

Saved…. WORKING !

Thanks Jeff and Darren (for the original set up)

1 Like