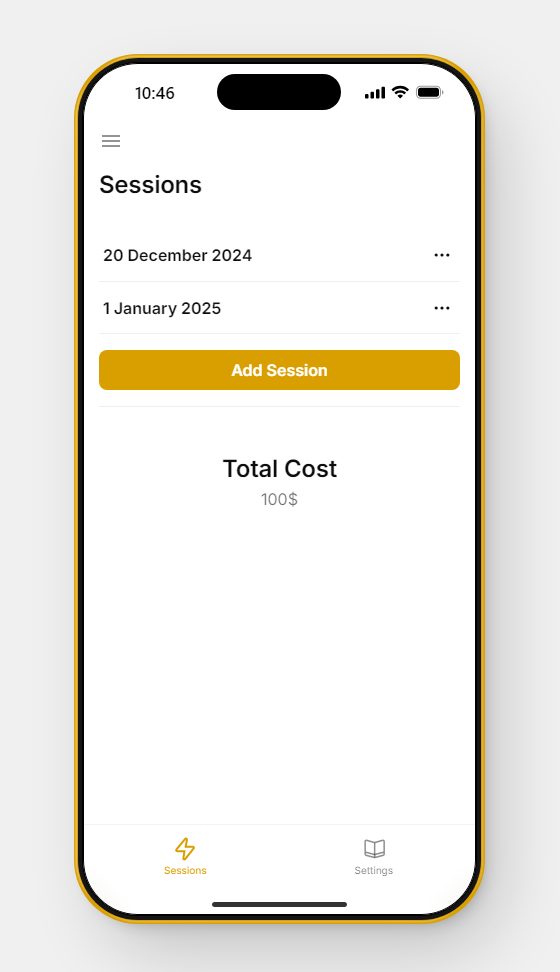
Trying to build my first Glide app after seeing an article about it on “how easy” it is (it was kind of a lie). Anyway, what I want is rather simple.
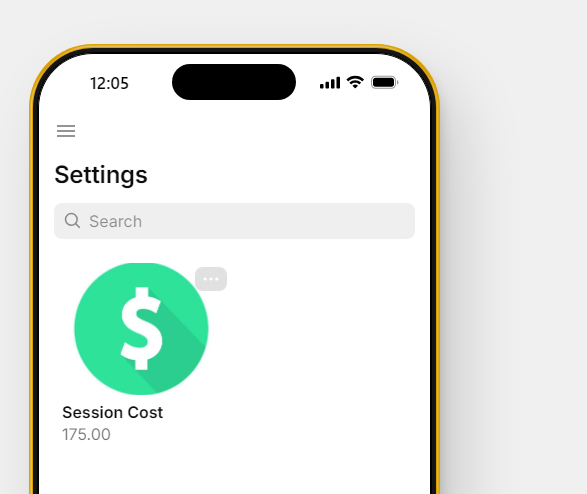
I am having PT sessions every month. I want to have a button that I press to record a new session. (this was simple - button → action → add current date to the date column).
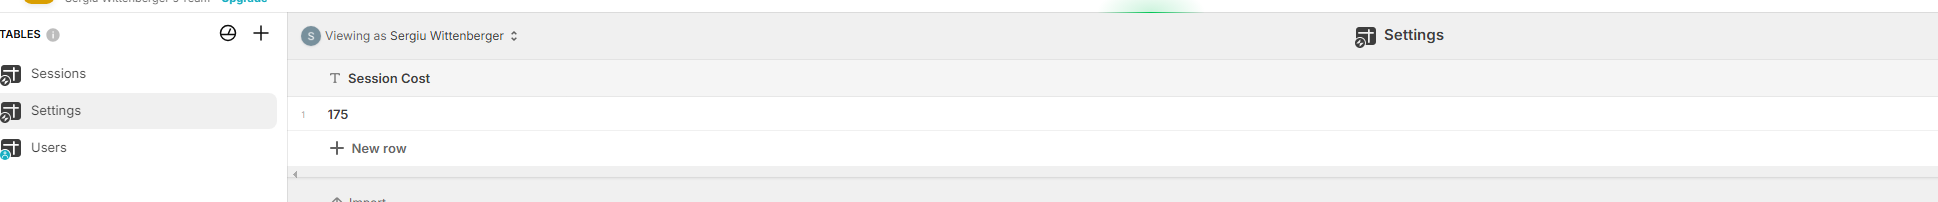
I have two tables: sessions / settings. In sessions I want to keep the session data, in settings the global data.
Now the math is simple → # of unique sessions days between the 11th of previous month to 10th of current * session cost.
I tried using openai/perplexity to find answers, I tried googling…but I failed. I find it too difficult to simply get the multiplication done, and filter it by the correct time filter.
Can you show how your data is structured? Do you have a start and end dates stored in one of your tables? If you do, then I’m thinking what you need is a Query column to find the sessions within that start and end dates, followed by a Rollup column to count the number of sessions in the query. Then you can use that number in a Math column.
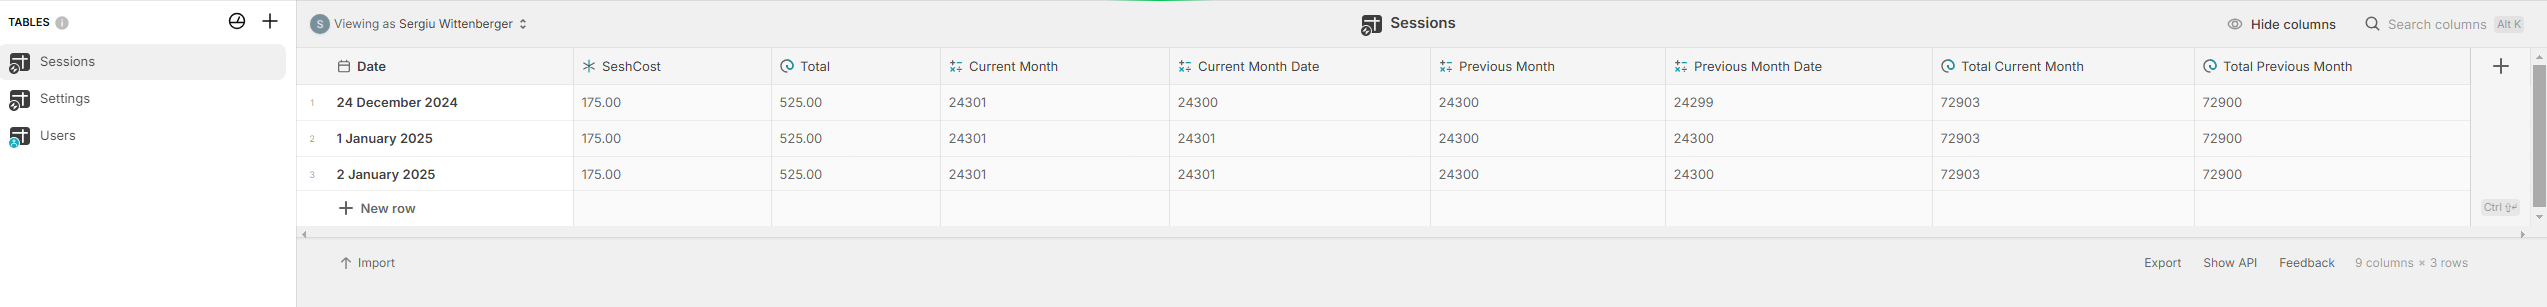
Tried importing the cost from the settings tab to the sessions and then I wanted to do a in a Math column the total for the month based on QCost( which is a query lookup in the settings table)
Okay, just going back to your original question, you said the “Total Cost” should amount to $100.
But I don’t see how that would be calculated based on what I see in your data tables?
Putting Glide aside for one second, can you tell me how that should be calculated?
Oh, right. So the $100 wasn’t based on the actual data.
Okay, so that’s pretty straight forward.
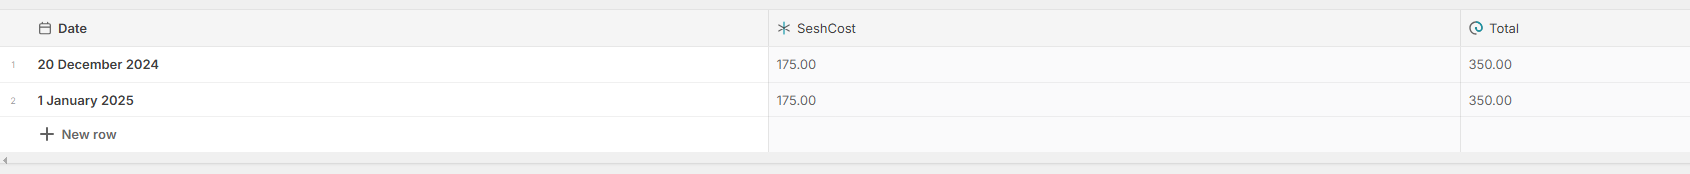
First thing you can do is replace that Lookup column in your Sessions table with a Single Value column. Target it at your Settings table and take “First → Session Cost”. You can then do a Rollup on that column to get a total cost for all sessions. (The result should be $350).
To breakdown by month, I need a little more information on your goal. For example, do you want to:
Select a month and show a summary for that month?
Show some sort of month by month breakdown in a table covering several months?
Something else?
All of the above (and much more) is certainly possible, just need to be specific about the goal
I changed as you mentioned the Lookup to single value → “first”, and added the rollup as you mentioned. It seems you need to define it as number for “sum” to appear, it doesn’t auto detect. That was confusing for me at first.
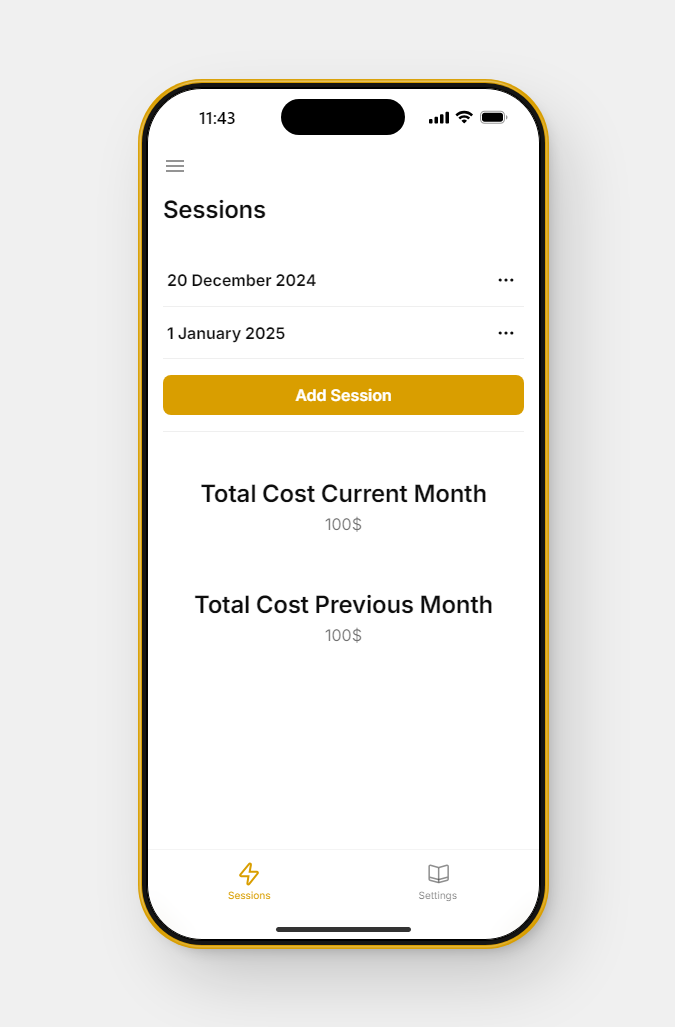
For your last question, I want to show the current month cost under the total as displayed in the first post. Though now that you mention it, it would be beneficial to also see the previous month cost total as well.
As mentioned this app is meant to be super basic. I will want to eventually add more features, but I need a starting point and to understand some of the functions (for instance the fact that I can’t do a rollup sum)
I also want to thank you for the help you have given me. I appreciate it a lot!
Yes, that’s correct. You can’t sum a text value. Well done on figuring that one out, it’s a common trap
Before I offer a solution, I have some more questions. There are multiple ways to approach this, but the preferred approach will depend on answers to these questions:
Will the Session Cost ever change?
If it would change, what would you expect to happen with the cost of past sessions? (ie. should they keep the original cost, or adopt the new cost?)
Does your App require sign-in?
If your App does require sign-in, do you have a Users table with User Profiles properly configured?
Are you the only user of your App?
If there are other users, should they also be able to view these monthly summaries?
Okay, well my suggestion would be to add the cost to the Sessions table as a static value when each row is added. Then it won’t matter if the cost changes in future.
For your “This Month//Last Month” totals, I would suggest the following approach:
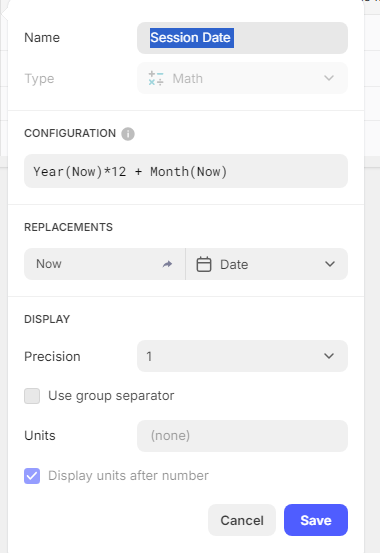
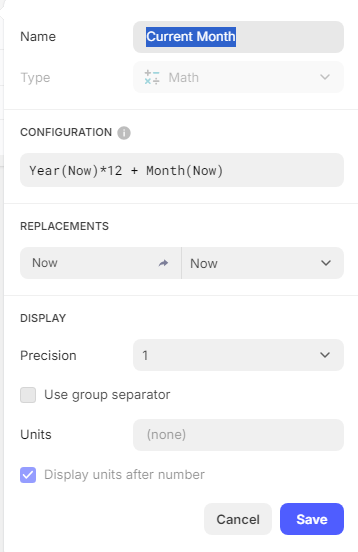
In whichever table is the source of the screen where you want to display this, create a Math column using the following formula:
Year(Now)*12
+ Month(Now)
In the above, use the special Now value as a replacement for Now. This will give you an integer representation of the current month
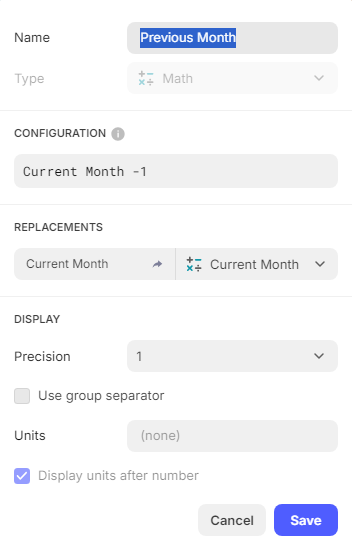
Create a second Math column for last month, subtracting 1 from the previous column
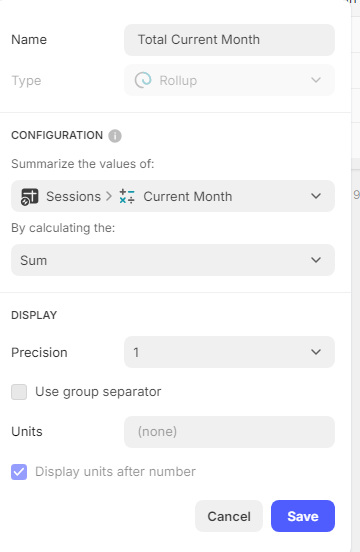
Now in your Sessions table, create an identical Math column as the first one above, but this time using the Session Date as a replacement.
Back in the first table, create a Multiple Relation column that matches “This Month” with the Math column in your Sessions table.
You appear to have one too many math columns, you should only have three, as follows:
One to get a number representation of this month
One to get a number representation of last month
One to get a number representation of the Session Date
Yes, you do need the relations. I’m not sure what your rollup columns are currently targeting, but they’re obviously wrong. The purpose of the relations is to filter the rows based on whether they are this month or last month, and then you do the rollups through the relations.
Your error is in the last screenshot. You are targeting the relation via the table. This is wrong. You need to target the relation directly. When selecting the target, pay close attention, you will see it in the list.