Right now I can see the total revenue per customer, but what I would like is: to display the overall revenue per month (all customers combined) in a chart.
Example:
September 2025 → €5,200
October 2025 → €6,800
Has anyone implemented something similar?
What’s the best way in Glide to aggregate revenue by month when the source data is individual orders with dates?
You should have a number that looks like 202509, which is Year and Month (YYYYMM).
Then, like I said, you could create a new table with a column that lists out each year and month in the same YYYYMM format for each row, and create a relation to link the new tablet to this table, followed by a Rollup to sum all related rows with the same year and month
Or you could just use the Orders table as the source of you collection where everything is grouped by that new YYYYMM column.
Or a third option is to try the Format Date column to get a value that is just month and date, but I generally don’t trust those experimental date columns because they don’t always play well across different devices and regions.
I’m sorry, I’m not very experienced with this.
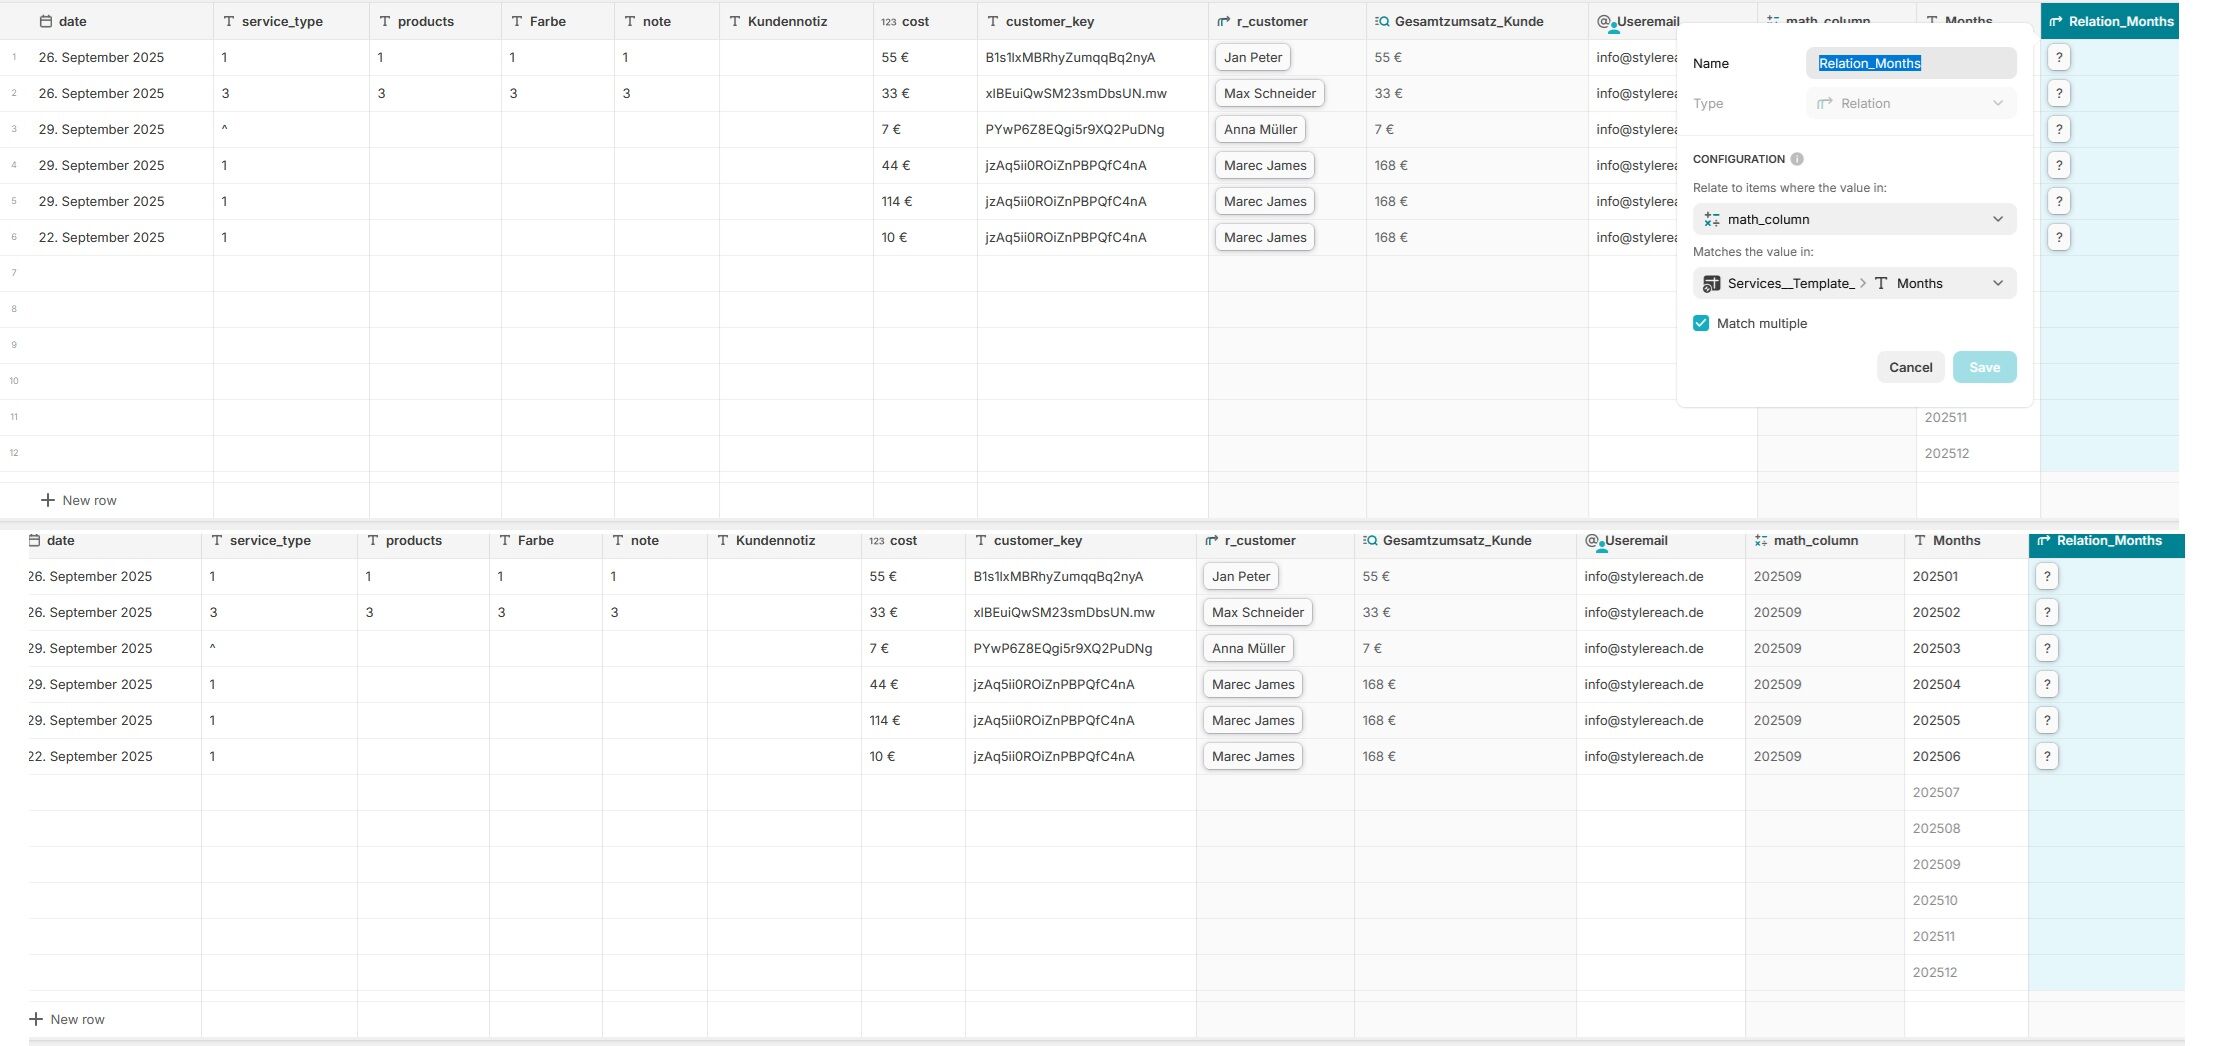
I tried to replicate the first option, and the date looks better now.
I created a column called Month and entered all the data manually.
Then I created a Relation column and linked Month and Date.
No. You are trying to link your Months column to the Date column. That complicaty ignores the math column you created to convert date to YYYYMM. Link the Months column to your math column instead.
Relations look for matching values. If the values don’t match, then your relation will be empty.
‘202509’ matches ‘202509’
‘202509’ does not match ‘29 September 2025’
Also, you need to check the Match Multiple box because you want the relation to find all matches instead of just one.
Link Months to Math. Not Math to Months. You want your Months column to find matches in the Math column for each month you typed in manually. This makes a lot more sense when doing it from a separate table instead of trying to do it in the same table.
The way you have it set up now, each row with September is only finding one match in the Months column, so your relation only finds one match. If you do it the other way, your September row in the Months column will find 6 matches and the other months will not find any matches.
When creating a relation, you are saying that you want to take a column value from each row and find all matches in another table or column where the value is exactly the same. The result is all rows that contain the same value when comparing the two columns.
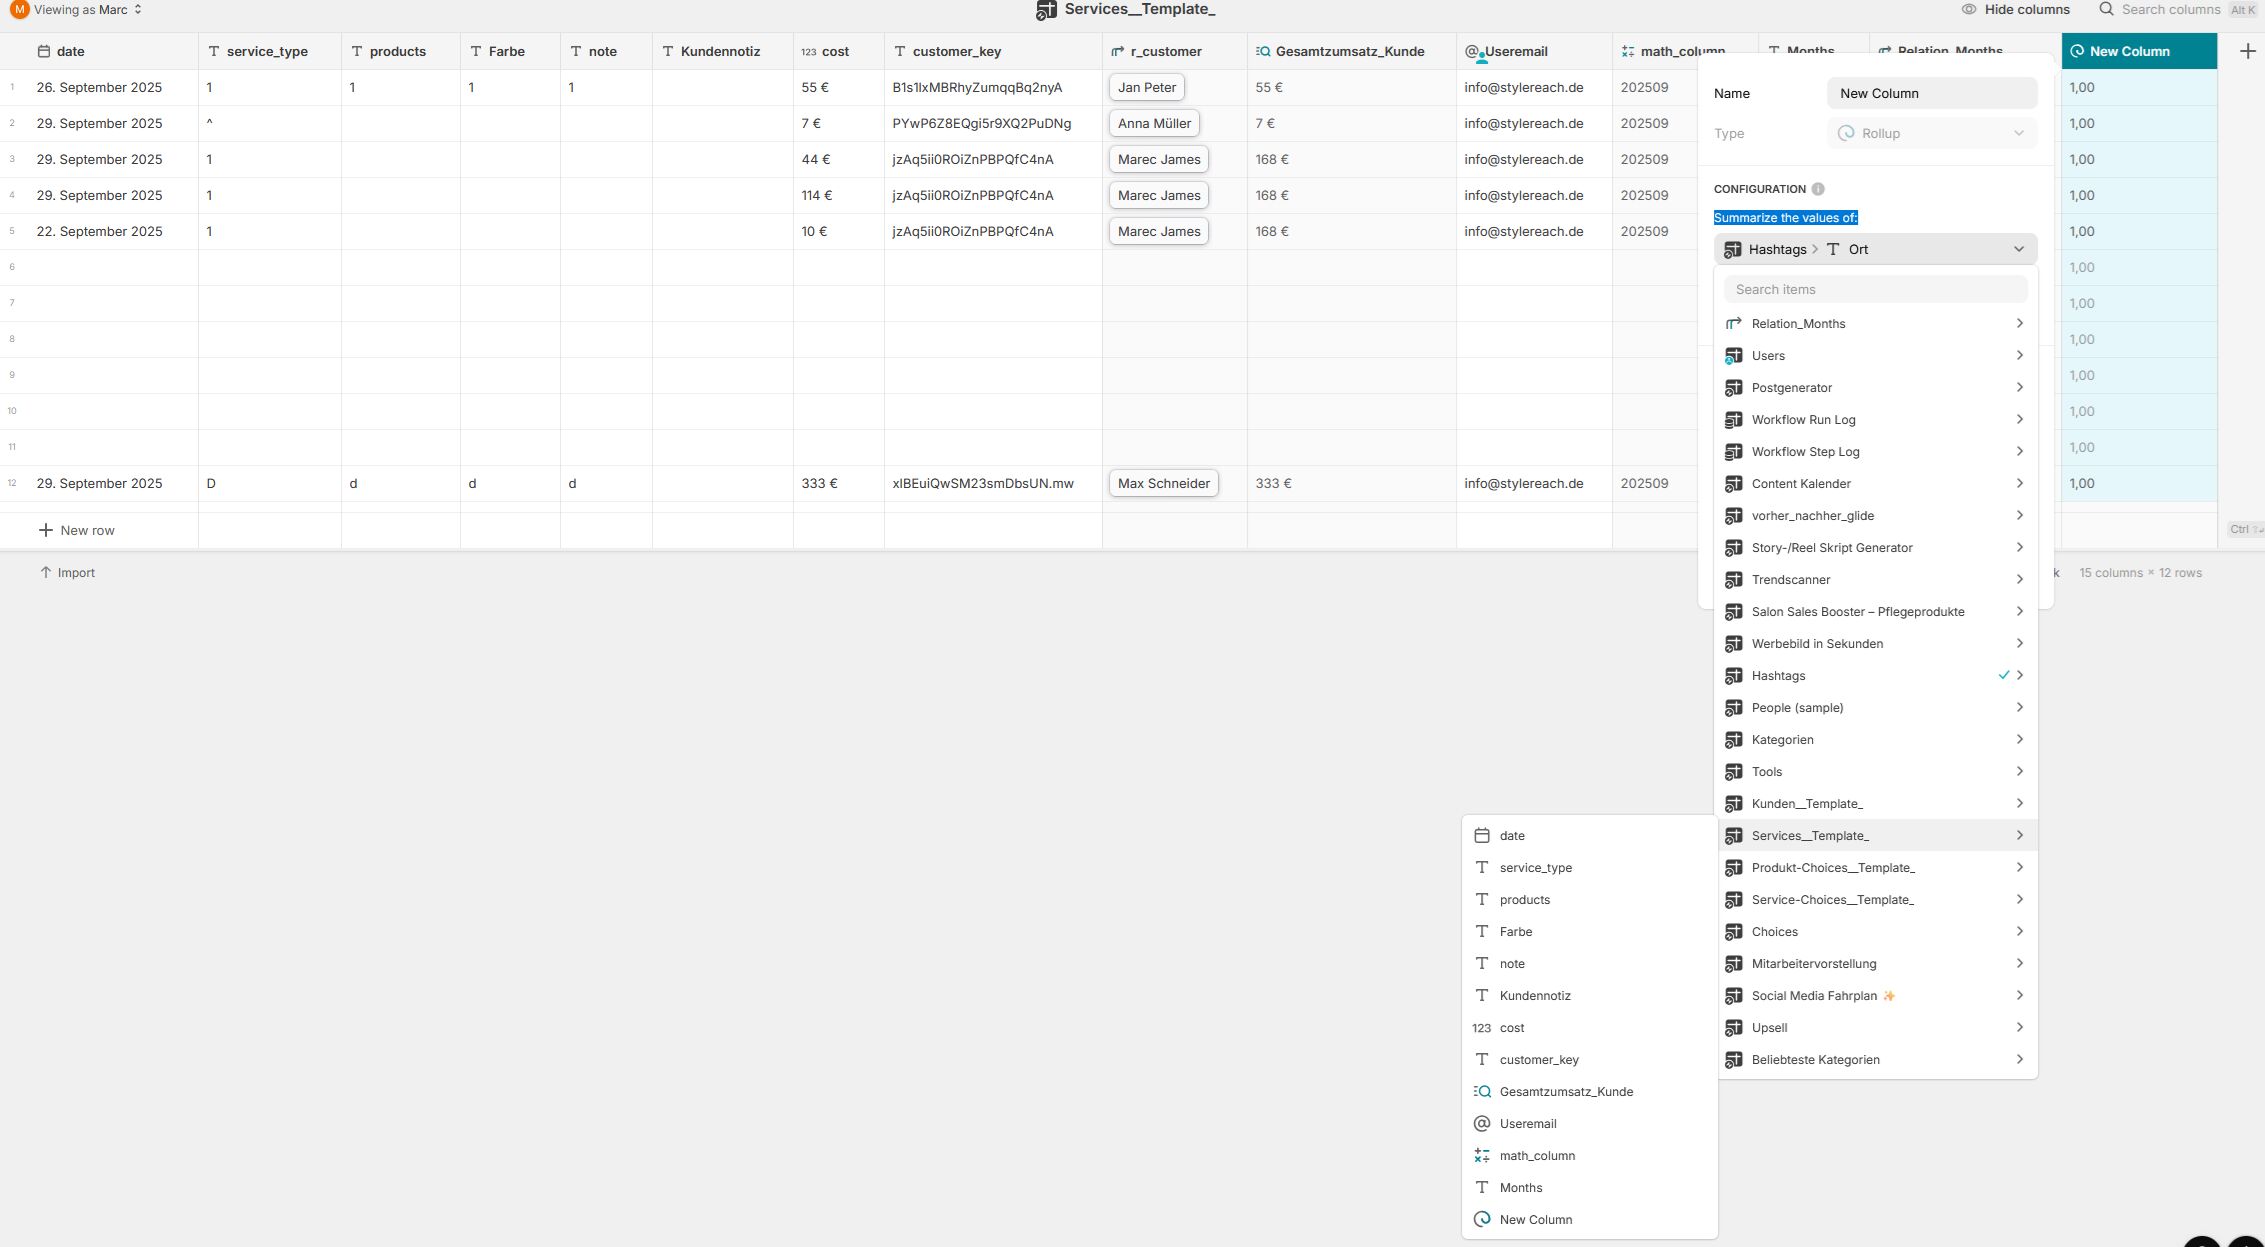
The next Step is a Rollup to sum all related rows with the same year and month.
The problem is that under “Summarize the values of” I can’t find the relation column to sum.
Thank you! For beginners this is really difficult. I know it’s hard for you to understand how someone might not know this, which is why I keep asking so many questions. This topic is completely new to me.
I have now found Rollup → Sum and the relation column. What exactly do I need to select inside the relation column?
I think I’ll still have 2–3 more questions before I finally get it right…
The column you want to sum to get the total for all customers in the same month. So I would guest the Revenue column or the Cost column??? Not sure which one you are trying to sum.
Now the next Problem:
Since a new column is added every time an appointment is created, the total revenue is counted multiple times for the same customer.
And the second problem is: the Date column in the screenshot is the one that gets filled in automatically when an appointment is entered. I didn’t take that into account in all my previous setup. How will the chart later know when that actually was?
That’s the problem with trying to multipurpose the same table to do multiple things. I edited my post above because I’m not sure if you want to sum cost or sum revenue. It appears that revenue is already a sum of cost per customer, so maybe you new rollup sould be a sum of cost instead of revenue.
I’ll say this again…this would make a lot more sense if you separated out your tables instead of multipurposing them. You should probably be building your customer Rollup in the customer table. The months Rollup should probably be in a separate months table. You can do it the way you are now, but obviously you will get duplicate revenue rollups per customer when they show up multiple times, and if you delete any of those first 12 rows, you will lose a month for your month rollup.
I don’t understand what you are asking here. When what was? If the date is filled in automatically, the math column will calculate automatically. There’s nothing else you need to do if set up properly. The relation and Rollup takes it from there. Currently, your only issue would be when next year comes and your list of months no longer have a matching year for new entries. That can all be handled automatically with a few changes, but we aren’t there yet so I won’t get into it as it will just make things more confusing and opens up a lot more questions as far as what you expect.