# Quickchart font color
**URL:** https://community.glideapps.com/t/quickchart-font-color/31706
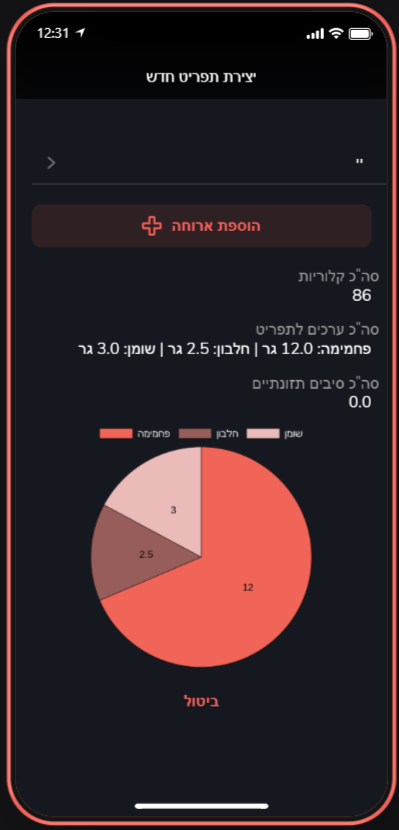
**Category:** Ask for Help
**Created:** [September 13, 2021, 9:00am UTC](https://community.glideapps.com/t/quickchart-font-color/31706 "2021-09-13T09:00:48Z")
**Posts on this page:** 20
**Page:** 1
### Author:  [@Lin\_Altshuler](https://community.glideapps.com/u/Lin_Altshuler)
#### Post date: [September 13, 2021, 9:00am UTC](https://community.glideapps.com/t/quickchart-font-color/31706/1 "2021-09-13T09:00:48Z")
Hi guys,
I designed a chart for my app but I cant figure out how to change the text color in a pie chart.
I tried: color, textColor, fontColor…
nothing in the documentation ☹
I also need to resize the chart to get is smaller without changing the labels.
I am also trying to insert this animation: animation.animateRotate: true
but have no idea where to put in.

```auto
{
type: 'pie',
data: {
datasets: [
{
data: [100,125,45],
backgroundColor: [
'#f16558',
'#965d5a',
'#eabbb9'
],
borderColor:'black',
borderWidth: 0.5,
},
],
labels: ['פחמימה','חלבון','שומן']
},
}
```
Please advice
Thanks
---
### Author:  [@ThinhDinh](https://community.glideapps.com/u/ThinhDinh)
#### Post date: [September 13, 2021, 9:25am UTC](https://community.glideapps.com/t/quickchart-font-color/31706/2 "2021-09-13T09:25:55Z")
Try this.
```auto
{
type: 'pie',
data: {
datasets: [
{
data: [100,125,45],
backgroundColor: [
'#f16558',
'#965d5a',
'#eabbb9'
],
borderColor:'black',
borderWidth: 0.5,
},
],
labels: ['פחמימה','חלבון','שומן']
},
options: {
legend: {
labels: {
fontColor: "black",
fontSize: 12
}
},
plugins: {
datalabels: {
color: "white",
}
}
}
}
```

---
### Author:  [@Lin\_Altshuler](https://community.glideapps.com/u/Lin_Altshuler)
#### Post date: [September 13, 2021, 9:32am UTC](https://community.glideapps.com/t/quickchart-font-color/31706/3 "2021-09-13T09:32:14Z")
Exactly!
---
### Author:  [@Lin\_Altshuler](https://community.glideapps.com/u/Lin_Altshuler)
#### Post date: [September 13, 2021, 9:36am UTC](https://community.glideapps.com/t/quickchart-font-color/31706/4 "2021-09-13T09:36:14Z")
anything on the animation and the pie size?
---
### Author:  [@ThinhDinh](https://community.glideapps.com/u/ThinhDinh)
#### Post date: [September 13, 2021, 10:16am UTC](https://community.glideapps.com/t/quickchart-font-color/31706/5 "2021-09-13T10:16:04Z")
How exactly do you want to change the size? I assume keeping everything else the same but the pie to be larger/smaller?
And what animation do you want?
It may not be available with Quickchart alone but Chart.js can support it through Yes-Code column.
---
### Author:  [@Lin\_Altshuler](https://community.glideapps.com/u/Lin_Altshuler)
#### Post date: [September 13, 2021, 10:29am UTC](https://community.glideapps.com/t/quickchart-font-color/31706/6 "2021-09-13T10:29:05Z")
Yes, keeping everything else the same and the pie smaller.
I would like to have it appear rotating
.
I don’t really know how to use YC ☹
---
### Author:  [@ThinhDinh](https://community.glideapps.com/u/ThinhDinh)
#### Post date: [September 13, 2021, 12:45pm UTC](https://community.glideapps.com/t/quickchart-font-color/31706/7 "2021-09-13T12:45:26Z")
Successfully done.
Demo:
Link to plugin your YC column:
[https://customized-pie-chart-js.thinhdinh.repl.co](https://customized-pie-chart-js.thinhdinh.repl.co)
Adapted from @Manu.n’s brilliant thread:
> [@Chart Polar](https://community.glideapps.com/t/chart-polar/31692):
>
> Hello, Here is a first approach to using graphics in addition to those offered by Glide. I used an open source library: there is another chart model than the one in the demo. WARNING: to integrate the graphic, I use the webview component, so you must have a pro package for this to work in publication !!! YC link [https://Graph-URI.manun2.repl.co](https://Graph-URI.manun2.repl.co)
---
### Author:  [@Manu.n](https://community.glideapps.com/u/Manu.n)
#### Post date: [September 13, 2021, 12:47pm UTC](https://community.glideapps.com/t/quickchart-font-color/31706/8 "2021-09-13T12:47:50Z")
oh too loud, much better than mine.
I just had the idea of proposing a version where instead of label, data, background it is possible to transmit the config, so that everyone can from the doc make their graph.
---
### Author:  [@Manu.n](https://community.glideapps.com/u/Manu.n)
#### Post date: [September 13, 2021, 12:53pm UTC](https://community.glideapps.com/t/quickchart-font-color/31706/9 "2021-09-13T12:53:04Z")
What is the data format for QuickChart?
It’s like the config?
---
### Author:  [@ThinhDinh](https://community.glideapps.com/u/ThinhDinh)
#### Post date: [September 13, 2021, 12:54pm UTC](https://community.glideapps.com/t/quickchart-font-color/31706/10 "2021-09-13T12:54:02Z")

Now supporting default width, height, label colors.
> [@Manu.n](#):
>
> What is the data format for QuickChart?
If you ask about the default data in the chart I defaulted it to what she described in her original post.
---
### Author:  [@ThinhDinh](https://community.glideapps.com/u/ThinhDinh)
#### Post date: [September 13, 2021, 12:54pm UTC](https://community.glideapps.com/t/quickchart-font-color/31706/11 "2021-09-13T12:54:38Z")
Yeah this can work, we can have the chart style customized to, to make it even more robust.
---
### Author:  [@Lin\_Altshuler](https://community.glideapps.com/u/Lin_Altshuler)
#### Post date: [September 13, 2021, 12:54pm UTC](https://community.glideapps.com/t/quickchart-font-color/31706/12 "2021-09-13T12:54:57Z")
🤯 🤯 🤯
That looks amazing!
but I’m stuck…


---
### Author:  [@ThinhDinh](https://community.glideapps.com/u/ThinhDinh)
#### Post date: [September 13, 2021, 12:55pm UTC](https://community.glideapps.com/t/quickchart-font-color/31706/13 "2021-09-13T12:55:50Z")
You just need to plug the data in. I already did that work for you.
Have a template that only returns Carbs, Protein, Fat by its data.
---
### Author:  [@Lin\_Altshuler](https://community.glideapps.com/u/Lin_Altshuler)
#### Post date: [September 13, 2021, 12:57pm UTC](https://community.glideapps.com/t/quickchart-font-color/31706/14 "2021-09-13T12:57:27Z")
That is unbelievable…
thanks so much.
If I ever want to change the design or the chart I will have to ask for your help again, correct?
---
### Author:  [@ThinhDinh](https://community.glideapps.com/u/ThinhDinh)
#### Post date: [September 13, 2021, 12:57pm UTC](https://community.glideapps.com/t/quickchart-font-color/31706/15 "2021-09-13T12:57:46Z")
If you want to make anything customizable then just tell me in this thread. I will make that part a variable so you just have to change it in the editor.
---
### Author:  [@Robert\_Petitto](https://community.glideapps.com/u/Robert_Petitto)
#### Post date: [September 13, 2021, 12:58pm UTC](https://community.glideapps.com/t/quickchart-font-color/31706/16 "2021-09-13T12:58:01Z")
We should be able to use parameters to define the type of chart, right? That way we don’t need separate repl’s for each chart type?
---
### Author:  [@ThinhDinh](https://community.glideapps.com/u/ThinhDinh)
#### Post date: [September 13, 2021, 12:58pm UTC](https://community.glideapps.com/t/quickchart-font-color/31706/17 "2021-09-13T12:58:33Z")
Yeah you’re right. We make this a variable.

---
### Author:  [@Robert\_Petitto](https://community.glideapps.com/u/Robert_Petitto)
#### Post date: [September 13, 2021, 12:59pm UTC](https://community.glideapps.com/t/quickchart-font-color/31706/18 "2021-09-13T12:59:42Z")
Yeah! Want to try it? I’m not proficient enough in JS to get this done quickly…
---
### Author:  [@Manu.n](https://community.glideapps.com/u/Manu.n)
#### Post date: [September 13, 2021, 12:59pm UTC](https://community.glideapps.com/t/quickchart-font-color/31706/19 "2021-09-13T12:59:51Z")
> [@Robert\_Petitto](#):
>
> We should be able to use parameters to define the type of chart, right? That way we don’t need separate repl’s for each chart type?
It was my proposal
---
### Author:  [@ThinhDinh](https://community.glideapps.com/u/ThinhDinh)
#### Post date: [September 13, 2021, 1:00pm UTC](https://community.glideapps.com/t/quickchart-font-color/31706/20 "2021-09-13T13:00:43Z")
Hehe if I have some time this week I would love to try it. Also make the colors customizable too. I love some Glide chart color palettes but sometimes I want to make my own as well…
[Next page](https://community.glideapps.com/t/quickchart-font-color/31706.md?page=2)